In the wake of the devastation wreaked along the East Coast by Superstorm Sandy, government agencies and private companies partnered to quickly and efficiently collect and analyze aerial data for emergency responders, relief and reconstruction workers, and the public in need.
When it hit the United States as a post-tropical cyclone, Sandy had a diameter of 1,100 miles and had been the largest Atlantic hurricane on record. It affected 24 states, including the entire Eastern Seaboard from Florida to Maine, causing particularly severe damage in New Jersey and New York. It clobbered the boarded-up big cities of the Northeast Corridor—including Washington, Baltimore, Philadelphia, New York, and Boston—with stinging rain and gusts more than 85 miles per hour. Storm surges, made worse by the full moon, caused high tides to rise about 20% higher than normal.
 In the wake of the devastation wreaked by Sandy, dozens of federal, state, and local agencies, as well as many private companies, contributed to the response. Among others, the National Geodetic Survey (NGS) took aerial imagery of the damage, ImageCat helped to analyze the data, Pictometry took oblique imagery, Woolpert flew lidar, and Esri helped FEMA set up a geoportal.
The NGS Mission
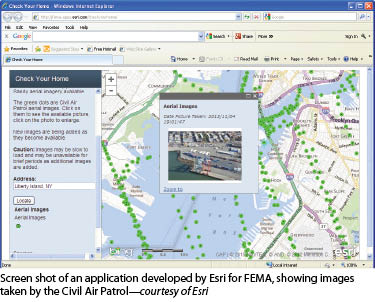
Primarily, two federal agencies were tasked to assess the damage from the storm: the Civil Air Patrol, a part of the U.S. Air Force Auxiliary, and NGS, a branch of the National Ocean Service of the National Oceanic and Atmospheric Administration (NOAA). One of NOAA’s programs is to fly and assess the shoreline for impacts to nautical charting, says Mike Aslaksen, chief of the agency’s remote sensing division. “As part of that mission, though, we also have other areas of responsibility within coastal zone management, as well as in scientific support to the Coast Guard for HazMat response, including oil spills,” says Aslaksen. “We are looking at areas of severe impact to navigation within the area affected by the hurricane.”
NOAA flew this mission from October 31 to November 9, for a total of 24 flights. It collected 12,664 images and surveyed 3,971 linear miles of shoreline areas north of Cape May, New Jersey, including most of Long Island’s south shore. The flights extended about two kilometers inland and half a kilometer offshore, for a total of about 2,790 square statute miles. As of mid-November, NOAA’s website had received around 34 million hits, and eight terabytes of imagery had been downloaded.
 Several federal agencies, including the U.S. Coast Guard, defined the mission’s requirements. “We place our flight crews and capabilities in stand-by mode ahead of a storm,” Aslaksen explains. “We provide pre-planned flight lines of the areas to be impacted and outline those areas that we prioritize for our missions and then see whether the other agencies have additional mission areas. We seek input from not only the Coast Guard, but, of course, the Federal Emergency Management Agency, the U.S. Geological Survey, the U.S. Army Corps of Engineers, the National Geospatial-Intelligence Agency, and the affected states. Our requirements overlap a lot with other agencies’ needs and typically overlap with the areas of highest impact, so there are multiple uses to this data.”
Challenges
For these missions, NOAA typically operates at an altitude of 7,500 feet, its preferred compromise between better image resolution and greater coverage. The agency’s Trimble Applanix digital sensor system (DSS) is optimized for that altitude, as is its in-air processing, thereby shortening the data turnaround. “However, the cloud deck was very low throughout our Sandy mission time and only allowed us to fly at about 2,500 feet,” Aslaksen explains. “We had to fly many more flight lines and images than we typically would and didn’t get as much coverage.” Therefore, while the lower altitude yielded a higher resolution, it slowed down the delivery of the imagery to the responder community.
Accuracy and Deliverables
 NOAA purchased its DSS about ten years ago and first used it to image Hurricane Isabel in 2003. It relies on an Applanix POS for direct geo-referencing and therefore does not require any ground truthing. “With the baselines we run,” Aslaksen explains, “we’re typically within one to two pixels of the resolution of the imagery, so, basically, one to two feet of accuracy is what we’ve assessed using our methodologies and assessing those outside a storm, as well as checking them against ground control in the area and our own internal geo-rectification workflows. We deliver 2.5-kilometer orthomosaics for download and access through a Web-mapping tile service or for direct download through our site. We also send the data to the USGS hazard data distribution system and to FEMA for their analysis and exploitation. The public, as well as other agencies, can get the data from our site as well as USGS, because those tiled orthomosaics are delivered through open source Web portals.”
The Role of Private Companies
The role of private companies differs from storm to storm. Usually, much of the imagery is provided by high-resolution electro-optical sensors on commercial imaging satellites. In Sandy’s case, however, the cloud deck’s persistence greatly limited their ability to collect cloud-free imagery.
“The private sector plays an important role, providing the baseline imagery for recovery—high-resolution orthos of the area affected, as well as lidar,” says Aslaksen. “In most cases, private companies are the source of the pre-event imagery, whether they collected it for the states, or for tax assessors, or whatever. They also track it over time.
“Within this event, probably one of the turning points was FEMA tasking ImageCat, as a subcontractor to New Light Technologies, to analyze the imagery,” says Aslaksen. “We’ve been working with them on developing this capability for a couple of years now. They used imagery to support individual assistance to home owners and assess damage to homes. Ultimately, this expedites funding support to the individuals affected so that they can then start the recovery process. It allows them to get hotels or rent homes, for example.”
U.S. Army Corps of Engineers (USACE) and U.S. Geological Survey (USGS) are contracting lidar collection to private vendors. “We’ll have access to that data,” says Aslaksen. “We work in partnership and coordinate very well, from my experience, and the sharing of data works very well with these partner agencies with which we work all the time.”
ImageCat
FEMA contracted with New Light Technologies, which sub-contracted with ImageCat. New Light Technologies’ director of operations, Sarah Weadon, says, “We were tasked to furnish damage assessment products using image processing and other geospatial techniques to meet the GIS requirements for Hurricane Sandy. We worked with FEMA to conduct imagery-based preliminary damage assessments or enhancing disaster mapping and situational awareness capabilities.”
“ImageCat has been responding to natural disasters for over ten years using a myriad of remote sensing technologies,” says Ronald T. Eguchi, the company’s president and CEO. “In the past several years, ImageCat has been working closely with New Light Technologies to support FEMA in their efforts to rapidly respond to significant U.S. events, including the 2011 Joplin, Missouri and Tuscaloosa-Birmingham tornados, the 2011 Minot floods, and, last year, hurricanes Isaac and Sandy. Our ability to mobilize experts from around the country to help assess post-disaster damage using high-resolution imagery has been key in FEMA’s response efforts to help individuals and local and state government agencies after these disasters.”
ImageCat used mainly high-resolution optical imagery collected by NOAA and the Civil Air Patrol covering nine states, including New Jersey, Connecticut, and New York. “Pre-event lidar data was available and was used by FEMA to generate storm surge inundation maps throughout the impacted area,” says Charlie Huyck, the company’s executive vice president. “Typically data transfer and management becomes the predominant challenge with incorporating remote sensing into disaster response,” he explains, “but having built an online platform for interpretation, we were able to harness hundreds of analysts and universities throughout the world. The key challenge then became insuring consistency of interpretation in accordance with our protocols.”
ImageCat’s deliverable was an imagery-based preliminary disaster assessment in the form of per-building interpretations of damage from wind and surge for the nine states, rated as “affected,” “minor,” “major,” and “complete.”
Pictometry
Pictometry, a provider of orthophotography and measurable aerial oblique imagery, captured the damage from Sandy partly at the request of government agencies and partly on its own initiative. During an emergency, explains Frank Giuffrida, the company’s senior vice president for engineering and chief engineer, both government and commercial customers are always frantic. “So, there are not always clear requirements,” he says. “Certainly some of our traditional customers reached out and funded us to do these flights, but we also did a variety of the affected area where we couldn’t get those commitments right away.”
The company captured 1.2 terabytes of data at approximately a four-inch ground sample distance with a spatial accuracy of about one foot on the ground, according to Giuffrida. “We use a direct geo-registration system that we have been perfecting over the last dozen years. So we do not require ground truthing in order to get the one-foot accuracy,” he says. “We captured 300 miles of shoreline from Cape May, New Jersey, at the southernmost tip, to the easternmost end of Long Island, which is Montauk Point, all as one contiguous area. We also did about 600 square miles of inland area of New Jersey and in and around New York City.”
Pictometry’s oblique imagery was particularly useful for identifying collapsed buildings, which cannot be done with traditional orthophotography because it does not reveal a structure’s height. “It may not be always obvious from a straight down view that a roof is collapsed until you look at it from the side,” Giuffrida points out.
The company’s oblique imagery was also used to map the extent of the storm surge, he adds, “by being able to see under eves, underneath overhangs, those types of situations.” This helped insurance companies make preliminary assessments of what damage was caused by wind and what damage was caused by water.
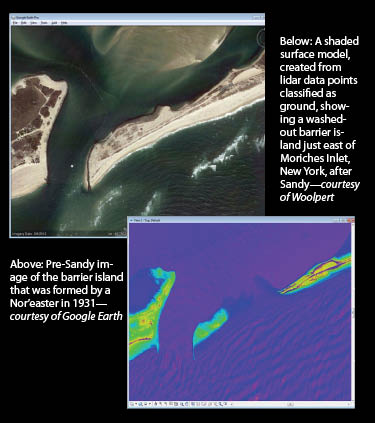
However, it was not possible to determine from the oblique imagery how high in a building the water had reached because, in most cases, it receded so quickly that it did not leave a watermark analogous to the mud line that the Mississippi left when it flooded. “What you can see very, very clearly, though, is where the sand was pushed in,” Giuffrida points out. “The amount of sand that this storm moved inland is just absolutely mind-boggling. There are now sand dunes that cover roads completely, and in the imagery you’ll see earthmovers moving the sand as if they were doing snow removal on the roads.” Pictometry’s oblique imagery is also helping with reconstruction planning, says Giuffrida. “There are still areas in some of these towns that are too dangerous to get into.” The ability to take both horizontal and vertical measurements from the imagery helps crews identify where to set up shop or how to bring in large equipment.
As in any disaster situation, speed was of the essence. In order to expedite its response, Pictometry assigned about eight aircraft to the mission, turned most of the data around overnight or by the next day, and made it available to its customers online through a special Sandy interface for its Connect Web application. It allowed its customers to view, in a mapping environment, archival imagery from before the storm as well as imagery shot just a day or two earlier and mash it against their existing GIS layers in order to assess damage, Giuffrida explains.
To complicate the mission, Sandy was preceded and followed by heavy rains, and Pictometry was forced to suspend operations during the strong Nor’easter that arrived only a couple of days after Sandy’s landfall. Like other responders, Pictometry also faced a much more mundane challenge in this mission: finding a place to base its planes due to a lack of hotel rooms for its pilots. “We ended up having to stage a lot of the operations as far away as Philadelphia in order to do the coastline,” says Giuffrida.
Woolpert
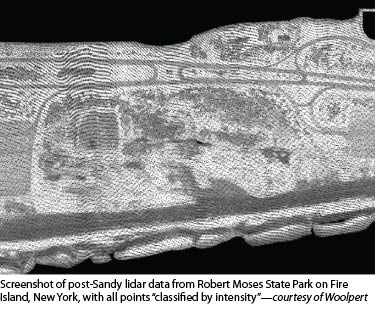
 Immediately following Sandy, Woolpert, a large design, geospatial, and infrastructure management firm, flew lidar missions in many of the affected areas. “The main reason for acquiring lidar data is to get the immediate and accurate elevation information, which imagery cannot provide,” explains Matt Schrader, one of the company’s vice presidents. The company was tasked for this mission by USACE and USGS, with which it has contracts.
“We were asked within a couple days of the task orders whether we had the capacity to do emergency response lidar work,” says Schrader. “Then, we worked out the scope and schedule. The scope was lidar only, no imagery, for areas of the Virginia, Maryland, and eventually New York coast. We acquired the lidar data at one meter nominal pulse spacing. Due to very close coordination between USACE and USGS, the specifications for both task orders were basically identical.”
Initially, Woolpert delivered the raw point clouds, just within a couple days of acquisition. It followed up with the classified LAS files, bare earth digital elevation models, metadata, and a report, as required, says Schrader.
The data the company collected will go to many of its clients who will use it to evaluate and quantify storm damage areas for upcoming USACE projects. “I’m sure that they’re also going to use it for some sort of hydrography and hydrology analysis and for change detection,” Schrader says. “They will use the topographic lidar data to assist in the assessment of storm damage and erosion of the coastal system.”
The main challenge, he explains, was the requirement to acquire the lidar data at mean low water. “It left us two very small flying windows per day, and we had bad weather during them. We acquired probably half of the flight lines at night, because that was the second low tide window every day, which made for some challenging coordination issues.
“Another challenge was turning around the raw point clouds as quickly as we did. We physically flew the hard drives back to our processing center in Dayton so that we could get a quicker turnaround. Additionally, we faced logistical challenges trying to find airports with fuel and hotels that were still operating close to the acquisition area for the field and air crews.”
Esri
 Esri, the largest vendor of GIS software, assisted in several ways with the effort to map Sandy’s damage. “When an event occurs somewhere in the world, we stand up a public information map that imports social media in the area of the event,” says Russ Johnson, the company’s director of public safety and homeland/national security. “We begin to understand what is happening based on what the people who are using social media tell us. Within 12 hours, we stand up a local impact map, into which we begin to take operational data. These data might come from a variety of places—such as imagery (if it is available that soon, often it is not) or from our people who are out in the field, supporting the affected emergency folks—and we begin to paint a picture, geographically, of the overall impact of the event.”
Esri staff then continue to refine that map, Johnson says. “We might put data from community analysts underneath it so that we understand the demographics affected. We might put in some critical infrastructure. We begin to post shelters and other relevant information about the local impact.”
Meanwhile, Esri’s team is reaching out to its affected customers to find out their need for assistance. “We stand up 24/7 technical support for those people who are having difficulty in any way. We also use some of our hardware and business partners and see what their willingness is to provide support, and we’ll facilitate that support to the local impacted area.”
During Sandy, Esri also helped FEMA with its geoportal that was based on Esri technology. “During the emergency,” says Johnson, “when they were really cranking and they were stretched, just like everybody, we provided some geoanalytic and technical support and capability to help them move that forward. Likewise, we were helping folks in Maryland with their Osprey application, in Baltimore with their ArcGIS Online portal, and we put three people in New York City to help offset the impact of GIS analysis that was required. Where anybody needed help with mapping the disaster, we were providing it.”
Esri also used its ArcGIS Online service to post imagery for the whole New Jersey shore area. “We worked closely with Digital Globe and GeoEye to obtain the good imagery that they had and posted it to make it accessible,” says Johnson.
Public-private Cooperation
Throughout this effort to collect and analyze data about Sandy’s impact and make it available to emergency responders, relief and reconstruction workers, and the public, government agencies and private companies relied on their complementary capabilities. The lessons they learned in the process and many of the structures they developed will serve the country well in future disasters.