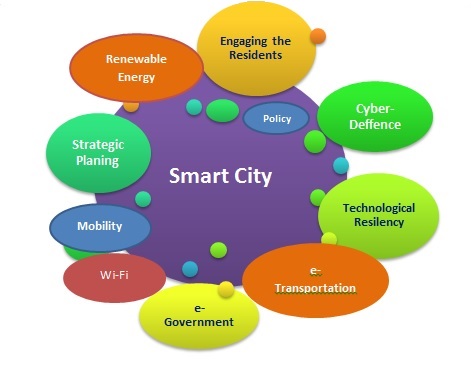
Ever since I saw the phrase “smart city,” I have cringed. Not because of the term but because of what it alludes to. To me it says that we (geospatial experts) haven’t done our work right. Let me explain.
From Wikipedia:
“A smart city is an urban development vision to integrate multiple information and communication technology (ICT) solutions in a secure fashion to manage a city’s assets.”
Now, my understanding, as a person who uses a GIS on a daily basis, was that a GIS was used to overlay and integrate multiple layers of information to gain insight and manage a project more efficiently. So, in reality, these two aren’t too dissimilar. In fact, when you look into it further, the [smart] platform is pretty much a GIS that links to live data and data that is structured to be interlinked [each data is linked to all the other data]. Oh, of course, there is some form of asset management, usually in the form of a CMS [Content Management System].
I guess my point is that I’m frustrated that many of us geospatial experts aren’t being “smart” with our data, and hands up, at times I can be one of you. I download a load of data, put it in my geodatabase, and don’t think twice about it until someone asks for it.
Here is a great example – I was working on site analysis of wind farms, and pretty much the job involved loading in all the environmental constraints, physical and topographical constraints, overlaying them, and finding gaps. The way it has been done for generations. Except I woke up one day and thought, “Why am I doing this?” and I looked at the data I was using and started to build a model (in Esri ModelBuilder), and what the model did was take all the files, spatially joined them (merging them with their attributes intact), and then doing a few tasks to turn the gaps in the data into polygons. I then made a centroid from the polygons and THEN did another spatial join on the data using the nearby setting.
What I ended up with was a fully automated way to find the best sites for a wind farm and also report back (in spreadsheet) what the nearest constraints were. Over time I found there were other data I could build into it, like land use, Land Registry land type (freehold/leasehold), and even some analysis to provide slope, average sun, aspect. Yes, three years ago I was working “smart,” unfortunately too smart for the company as this new-fangled technology wasn’t as good as having somebody rummage through by hand to find the best locations (even though the best sites were the ones the computer picked!).
Let’s have a look at the principle behind this:
Knowing that we were trying to find areas suitable for wind farms, the area needs to be unbuilt land; it needs to be not within 250m of a building; it shouldn’t be closer than 40km from an airport (though it could be); it shouldn’t be on anywhere too steep or next to an existing wind farm. Obviously it shouldn’t be in any of the environmentally sensitive areas.
Most of the data is open data.
Environmental constraints: Natural England
Wind farms: The Crown Estate and Restats (renewables statistics)
Land Registry land type: Land Registry
Land Use (rough)
Topography (buildings, terrain): Ordnance Survey Vectormap, Strategi & Open Map
And (curiously enough) farms, restaurants, business parks, and other points of interest were extracted from my car’s GPS navigation device (extracted as a csv).
The model would then look a little like this:

But there are other ways to be smart
The former method uses a spatial join technique whereby features that lie in the same location are combined into a large dataset which can be interrogated. Another technique is to join tables of related information to enhance the data about location; this is quite commonly used in demographics but can be used anywhere.
A great example of this would be the neighborhood statistics websites whereby they provide information about your locality. Let’s have a look at how this can be done with openly available data.
If we download the Super Output Areas (average population approx 1000) from National Statistics, we can then join most of their data based on Super Output Area [SOA] ID

Output area types

By joining the area code to the area code in the table we can extract informative data
As you can see, this can be used to create much more informative data—some software vendors might even call it “enriched” data—and it is extremely easy to do.
….and then you realize that you can THEN spatially join this data to buildings, political boundaries, offices, and all other types of data to extract SMART data about the locations.
My challenge to you today is to “enrich” the next data you use, if only for your own satisfaction, add some demographic data to it, add some Wikipedia data to it, spatially join it with the INSPIRE Land Registry polygons (while you can). Go on, do it … that sense of satisfaction, THAT is why you do GIS.
Nick D

