A new market is emerging for aerial mappers as investment in renewable energy grows
Public and private utilities are focused on diversifying their energy portfolios after years of research and testing have improved the efficiency and reliability of alternative power generation methods. Support for the development of clean-energy options has never been stronger, creating an opportunity for renewable resources, such as wind, to play a much larger role in the power grid.
“In 1990, 16 countries generated a total of about 3.6 billion kWh of wind electricity. In 2019, 127 countries generated a total of about 1.42 trillion kWh of wind electricity,” according to the U.S. Energy Information Association (EIA). “The share of U.S. electricity generation from wind grew from less than 1 percent in 1990 to about 8.4 percent in 2020.”
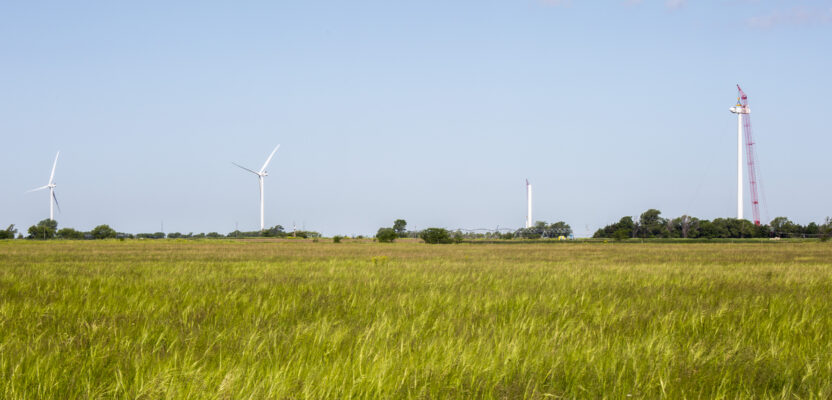
Grande Prairie is a 400-megawatt wind power project in northeast Nebraska spread over approximately 45,000 acres of farmland and pasture. Photo credit: OPPD.
Wind farms are creating a new revenue stream for aerial data acquisition firms since up-to-date maps are needed for site selection and development. Throughout the process, many factors must be considered, including topography, proximity to roads and transmission lines, and environmental and wildlife impacts. Development of a wind farm can take four to five years from initial prospecting to the start of operations, with aerial data providing vital information along the way.
Get the Big Picture
Cornerstone Mapping, based in Roca, Nebraska, works on a variety of projects, from wide-area agricultural mapping to high-accuracy engineering projects. The firm owns three aircraft and a variety of sensors, including a large-format UltraCam Eagle aerial camera, midwave and longwave thermal cameras, a hyperspectral scanner, and a Riegl lidar laser scanner. Over the past 10 years, Cornerstone has experienced a steady increase in demand for airborne data acquisition services for wind farms.
“I’ve definitely seen more wind farms popping up around the Midwest, and I’ve been hired by engineering and mapping companies to acquire aerial imagery in the early stages of wind-farm site selection and construction,” says Aaron Schepers, owner of Cornerstone Mapping. “The interest in green energy is creating a lot of growth in the area.”
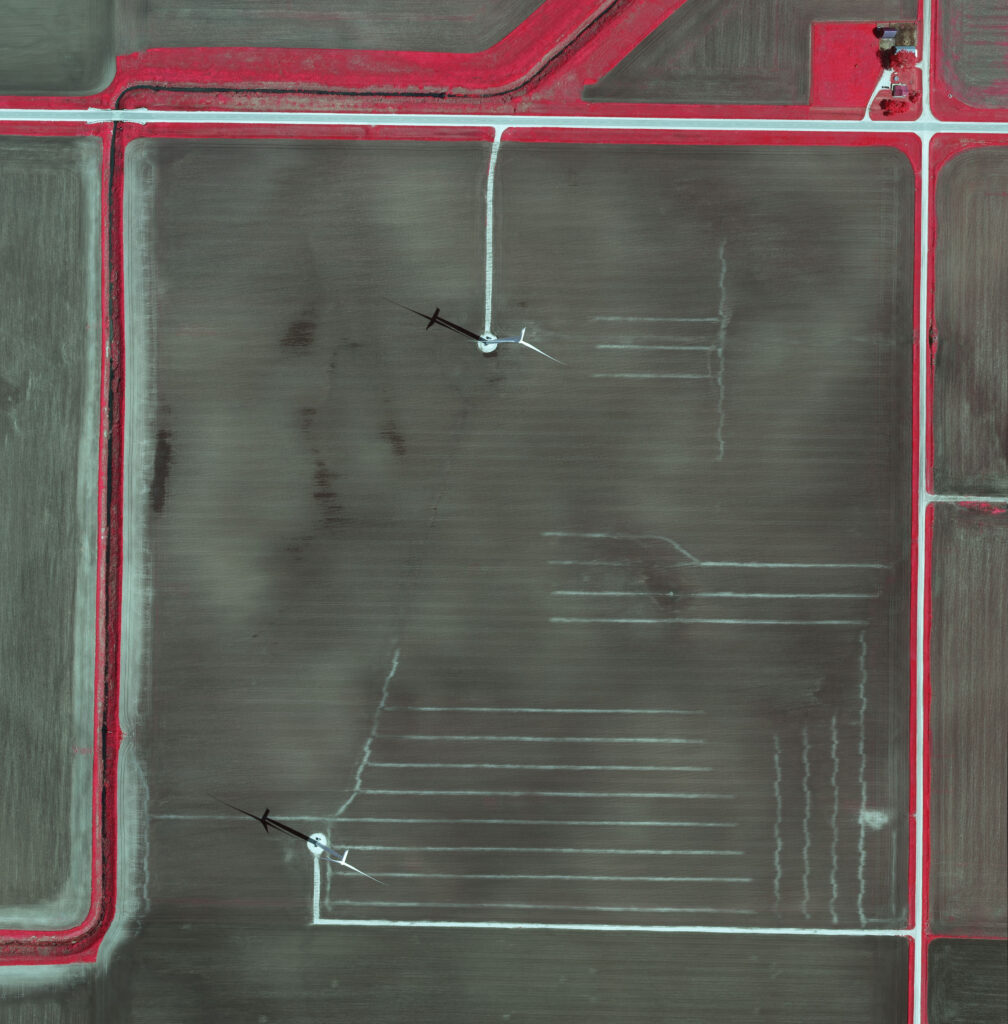
The linear, light-colored lines in this CIR image shows a recent tile line installation. During installation the subsoil is mixed with the surface soil, which changes the soil composition and color. Photo credit: Aaron Schepers.
Projects typically are new developments or expansions to existing wind farms, and aerial imagery is used for topographic and planimetric mapping, along with existing structure mapping during multiple phases. Coarser resolution imagery (12 to 15 cm) is used for evaluating the landscape and layout of the wind farm. As the project development progresses, higher resolution imagery, 5 cm to 10 cm GSD, is used for the design phase. Wind farms in the Midwest are often built on private farmland, so some sites are flown multiple times to quantify damaged crops in a farmer’s field during the construction phase.
States east of the Missouri River receive more rain than in the west, so it is common to bury perforated tubes called tile drains for improved crop production. To avoid or minimize damage to the below-ground infrastructure, wind-farm developers also may request tile-drain mapping, which is performed with a thermal camera.
“If thermal mapping is needed, I combine a one-meter GSD orthorectified thermal mosaic with other data layers to identify the likely location of the tile drains,” says Schepers. “Drained soil heats up more quickly and appears red in the thermal images, while wet areas stay cooler. I fly some thermal projects at night for even greater contrast.”
Most wind-farm projects are flown with the same requirements and methodology as other photogrammetric projects. Careful consideration is given to flight plan layout, ground control, sun angle, and flight conditions. The majority of wind farms that Cornerstone has flown are under 100 square miles, although some are as large as 400 square miles.
“My large-format camera has excellent geometry and radiometry and four-band capability. Usually I deliver raw TIFFs, exterior orientation (EO), and camera calibration, and my clients process the data,” says Schepers. “It is very efficient for large area collects—the terrain I can cover in an hour would take days with a UAV.”
Driving Demand for Renewables
In the early 2000s, the average turbine generated less than one megawatt (MW) of electricity, compared to today when taller turbines with longer blades generate up to three MW on land (and even more offshore). The greater efficiency lowers the cost of construction per kilowatt hour and makes wind power more attractive to developers.
The United States Geological Society (USGS) maintains a U.S. Wind Turbine Database that lists more than 67,000 turbines as of January 2021, spread across 44 states, Puerto Rico, and Guam. Leveraging its plentiful open space and consistent wind conditions, Texas currently has the largest electricity generating capabilities from wind, followed by Oklahoma, Iowa, and Kansas.
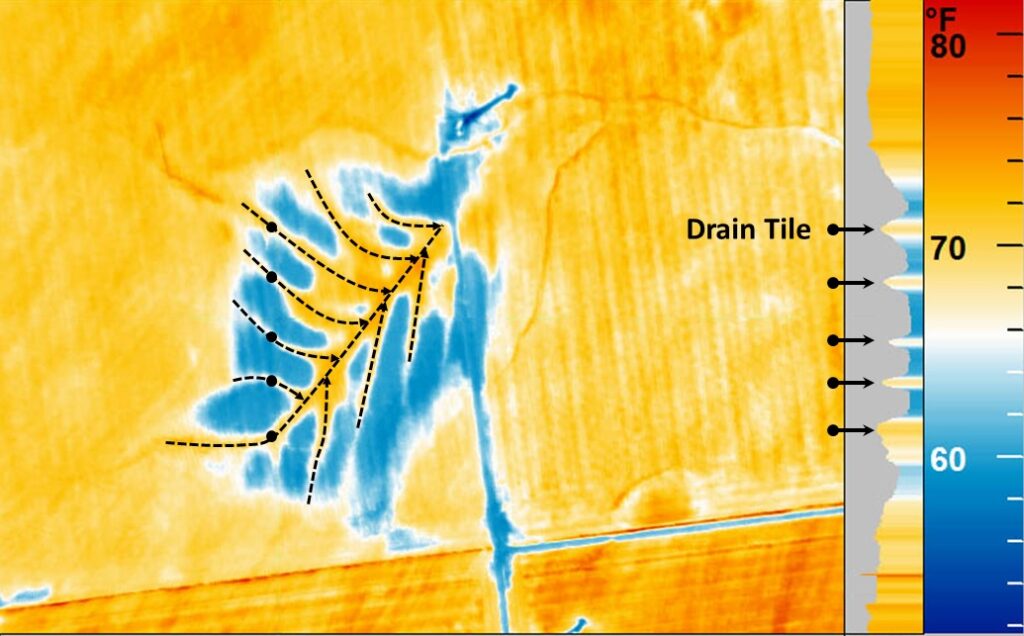
In this thermal image, wet soil appears blue (cold), while the dryer soil is orange (warm). The tile lines are located down the middle of each orange “finger.” Photo credit: Aaron Schepers.
The Omaha Public Power District (OPPD) in Nebraska is representative of how utilities are planning for the future and setting goals to reduce their carbon footprint. Back in 2001, OPPD started testing a single-wind turbine west of Omaha to assess the feasibility of adding wind to its energy portfolio. As the cost of wind generation dropped significantly over the past 20 years, OPPD added capacity. At this time, OPPD has participation agreements with 10 wind energy centers generating approximately 1,000 MW of electricity, which is approximately 35 percent of the power needed to serve its 850,000 customers in the 5,000-square-mile service territory.
“By diversifying with renewable energy, we are building a resilient and reliable power grid while keeping energy affordable,” says Javier Fernandez, president & CEO of OPPD. “There are many factors to consider. We juggle competing concerns, such as landowner rights, environmental sensitivity, and agricultural operations. We only work with developers who understand our local zoning requirements, setback requirements, and water rights and can effectively communicate with the community.”
As the power generating capabilities of each turbine increases, siting analysis has become even more important to ensure maximum output without overloading the transmission lines. The flow of energy is also impacted by differences in substations and regional conditions.
“Across the Midwest and Nebraska, we have constant and powerful wind, but there are a limited number of transmission lines to carry the power,” explains Fernandez. “If we put too many wind farms in one area, there is congestion in the lines, which can cause damage.”
To help meet its goal of net-zero carbon production by 2050, OPPD is also siting and developing up to 600 MW of solar capacity, and up to 600 MW of backup natural gas. OPPD recently signed a contract with Community Energy, Inc., for an 81-MW solar array spread across approximately 500 leased acres south of Yutan, Nebraska.
Aerial data combined with other information helps determine optimal locations for solar farms based on sun slope, topography, and proximity to load demand. Each MW of solar power requires five to seven acres, so a total of 3,000 to 4,000 acres will be needed to generate 600 MW.
Aerial Data for New Markets
Today, electricity powers everything from cars to computers, and demand is only going to increase. Utilities are balancing the expectations of their customers for affordable power with the environmental impacts of power generation. With improved technology and government initiatives, the cost of renewable energy has dropped significantly, guaranteeing further development in nearly every state. Aerial mapping of wind and solar farms provides the basis for thorough site analysis and supports the further diversification of energy portfolios across the country.
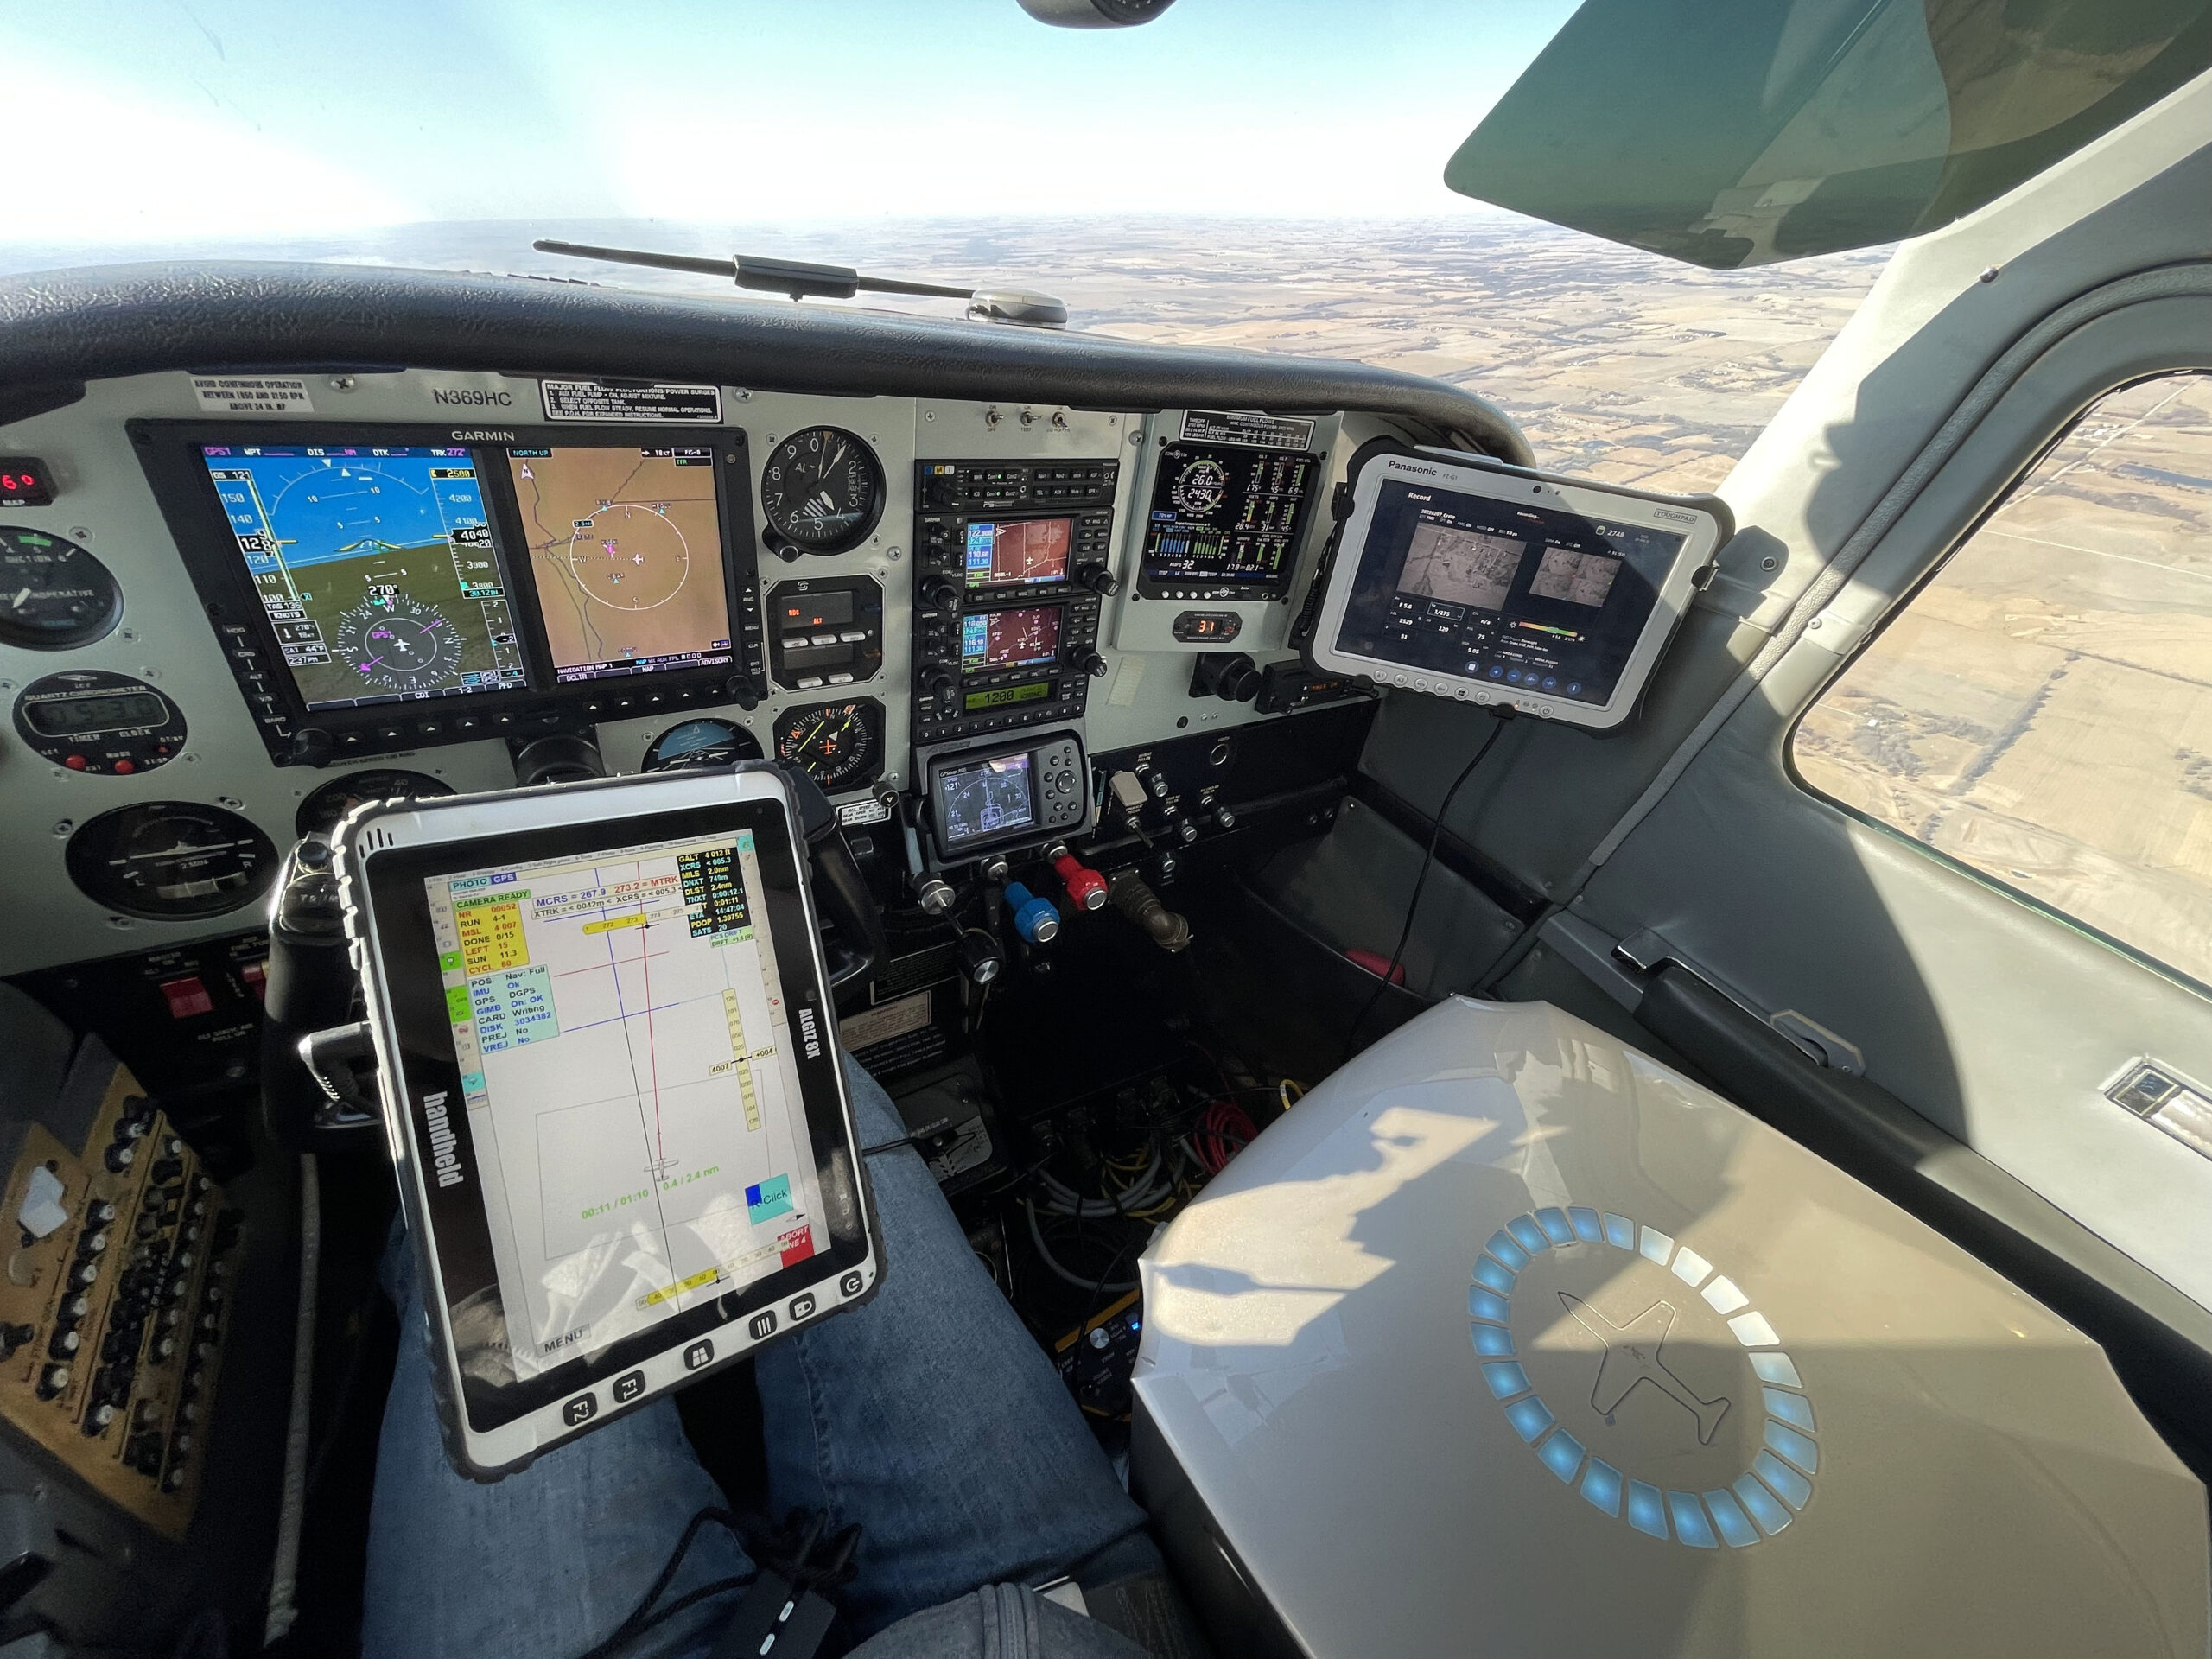
The compact Cessna 210 aircraft cockpit has the flight management system (FMS) on the pilot yoke for flight line navigation and camera trigger, the camera interface monitor is to the top right and the UltraCam Eagle is in the co-pilot position. Photo credit: Aaron Schepers.