Producing GIS-ready 2D and 3D products to support decisions in transportation.
Transportation planners and engineers have often made use of remotely sensed data such as overhead imagery and lidar for mapping, measuring, and monitoring transportation networks. However, despite its utility, remote sensing has failed to achieve its full potential. Remote sensing should be able to take the place of many field survey techniques, which are costly and, in the case of disaster response, dangerous.
Remote sensing hasn’t reached its potential due to the inherent limitations of our current systems. Satellite systems often lack the spatial resolution to image features of interest, and a combination of orbital characteristics and atmospheric conditions can interfere with data collection. Manned aerial systems can overcome these limitations, but at a cost. The result is that the transportation sector rarely has access to the type of remotely sensed data they need, at a time when they need it, and at a cost they can afford. Enter the UAS.
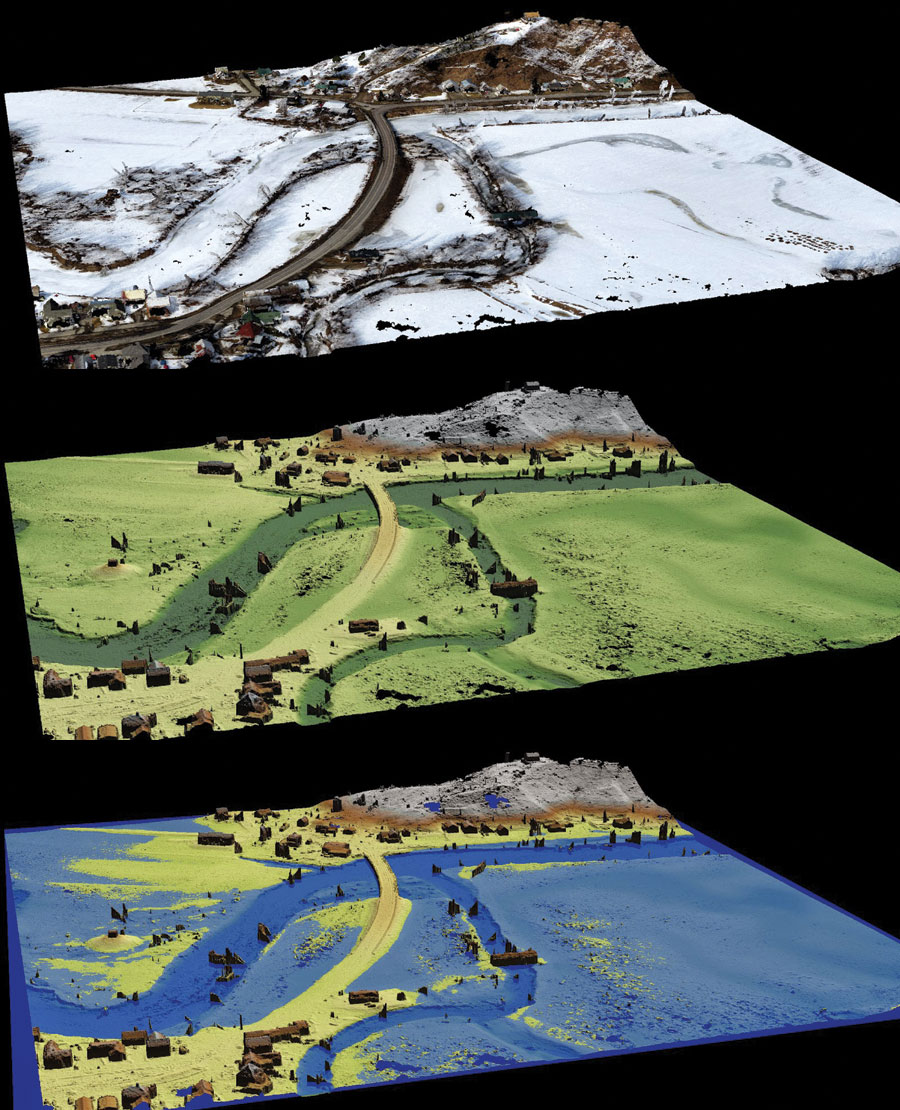
Top: 3D point cloud from an eBee flight on March 20, 2015 to monitor flooding for a U.S. Dept. of Transportation project.
Middle: 3D terrain model generated from the point cloud.
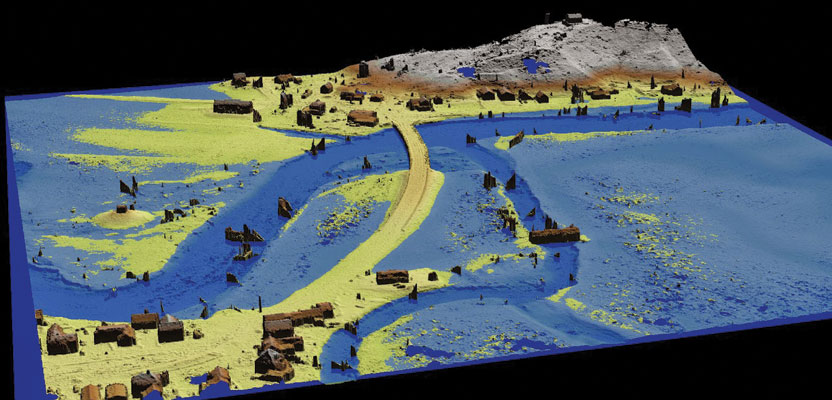
Bottom: Simulated flood conditions created using the terrain model and the software, Quick Terrain Modeler.
sUAS
Unmanned aerial systems (UAS) are a hot topic right now and have received a lot of hype. For the transportation sector this hype is well-founded, especially for the small, lightweight systems (sUAS) that are capable of producing GIS-ready 2D and 3D products.
Mapping-grade sUAS are distinguished by the fact that they are complete systems in which flight planning, data collection, and post-processing capabilities are integrated through a collection of hardware and software. A suite of integrated hardware and software enables these systems to capture and process imagery effectively and efficiently to yield GIS-ready products.
For example, the senseFly eBee weighs less than two pounds and can acquire hundreds of acres of imagery in a single flight. Much like other mapping-grade systems, it’s a fixed-wing system made out of styrofoam. It’s powered by a lithium battery that provides up to 45 minutes of flight time, and the imaging system is nothing more than a higher-end consumer digital camera.
In order to generate mapping-grade data, these sUAS operate autonomously based on user-defined flight plans. The user specifies the settings for the flight, including the take-off and landing locations, desired resolution, and maximum altitude. This information is then uploaded to the sUAS. When launched, the sUAS follows the flight plan, acquires the image, and lands. These flight plans insure that imagery is captured in such a way to allow for precise orthorecitification.
With the main purpose of these sUAS systems being the generation of GIS products, they don’t stream data in-flight, nor do they acquire video. Because they operate in a similar fashion to traditional aerial imaging programs there is less concern about privacy that arises with other UAS, such as quadcopters mounted with video cameras.
Generating the 2D and 3D products is done via a tightly integrated digital photogrammetric workflow that allows the images collected by the sUAS to be transformed into GIS-ready products within a matter of hours. The eBee system, for example, yields 2D orthorecitified imagery in GeoTIFF format and colorized point clouds in LAS format, allowing the data to be used in practically any geospatial software package.
Accuracy depends upon a number of factors, but our work, funded by the U.S. Department of Transportation, has found that the horizontal accuracy is typically with one meter without ground control points. Relative volumetric measurements, when compared to those obtained with terrestrial lidar, were within 5%. Absolute vertical accuracy was less impressive but could be brought to within half a meter when ground control points were used.
New systems, such as the eBee RTK, offer centimeter vertical and horizontal accuracy using real-time correction data. This level of accuracy means that sUAS data can be integrated with existing lidar, imagery, and vector datasets such as site plans.
Transportation Uses
Due to their ability to quickly gather data and generate accurate GIS-ready products, sUAS will open new opportunities for the transportation sector. Here at the University of Vermont Spatial Analysis Lab, we used sUAS imagery for a truck bypass construction project. The acquisition time for the 2.1-mile stretch was under two hours, and generating the orthophoto mosaic took less than nine hours, resulting literally in next-day service.
The short duration of the flight combined with the largely automated processing of the data makes for an extremely cost-effective solution, allowing sUAS imagery to be acquired regularly over the course of the project. sUAS data overcome some of the limitations of traditional field-based reporting for activities ranging from status updates to environmental compliance.

Top: Color infrared imagery collected on April 9 prior to any flooding.
Bottom: Color infrared imagery collected six days later showing evidence of flooding.
Mangers can access the sUAS imagery from any location through web-based mapping services, providing them with a timely, comprehensive, and detailed depiction of what’s happening on the ground. The sUAS imagery also serves as a digital record should contract disputes, environmental lawsuits, or other issues arise.
In Vermont we’ve also been monitoring flood in the Lamoille River where it passes through Cambridge, Vermont since mid-March as part of a U.S. Department of Transportation-funded project. The Lamoille causes flooding in Cambridge nearly every year, often affecting travel on Route 15, a crucial link in the transportation network in this part of Vermont.
Our team captured imagery of the flooding using our senseFly eBee. We used a color infrared (CIR) camera as water absorbs the majority of near infrared light, making it ideal for mapping the extent of the flooding. Fortunately for people who rely on Route 15, the flooding did not reach the road this spring, but the process of tracing the water-level rise using sUAS demonstrates that remotely sensed data can be acquired and disseminated to decision makers in a timely manner. This data collected marked the first instance of remotely sensed data capturing flooding conditions in this area.
The imagery produced from the eBee is orthorectified, allowing it to be readily integrated into GIS software, where measurements can be made to compute the flooded area. Acquisition time for the imagery (the left image on the facing page) was 75 minutes. It took 3.5 hours to generate the digital orthophotos.
In March we collected data at a slightly higher resolution and with additional overlap, allowing us to produce a 3D point cloud that we turned into a detailed terrain model. We ran quick flood simulations using Quick Terrain Modeler and found we were able to simulate the April 15 conditions quite well. By our calculations a rise of about 1 foot will push the water onto Route 15.
UAS won’t replace traditional remote sensing technologies for broad-area mapping in the near future, but if the recently proposed regulations for UAS proposed by the FAA take effect, we should finally see UAS integrated into U.S. airspace in the next two years. The transportation community needs to familiarize themselves with the capabilities and limitations of sUAS if they are to capitalize on this technology.
Funding for this project was provided by the U.S. Department of Transportation. Collaborators include the University of Vermont, Spatial Informatics Group, senseFly, and Applied Imagery. Disclaimer: the views, opinions, findings, and conclusions reflected in this article are the responsibility of the author only and do not represent the official policy or position of the USDOT/OST-R or any State or other entity.