Imagery was collected along 77 miles of shoreline to provide a better understanding of Pennsylvania’s natural resources.
By Brian Stevens
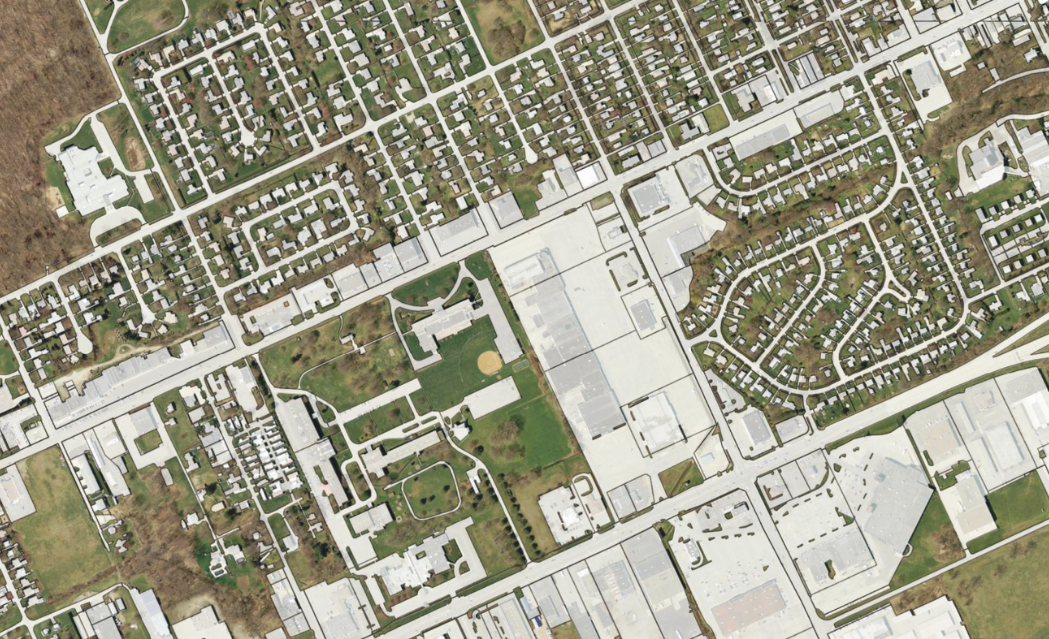
This dataset maps impervious surfaces and shows building footprints.
The Pennsylvania Lake Erie Watershed is a substantial part of the world’s largest surface freshwater system, the North American Great Lakes. The watershed is 512 square miles, consisting of 15 major sub-watersheds. It’s estimated that more than 11 million people in both the U.S. and Canada get their drinking water from Lake Erie, and private and commercial users extract a total of 70 million gallons of water from the lake every day.
With the economic and environmental future of this multinational region at stake, accurately analyzing the current condition and predicting the long-term state of this critical water resource is of paramount importance.
To better understand one of the state’s most vital natural resources and accurately plan for the future, the Pennsylvania Department of Environmental Protection (PADEP), through grant funding provided to the Pennsylvania Sea Grant (PASG) College Program, partnered with Woolpert to acquire imagery and lidar data for the entire Pennsylvania Lake Erie Watershed and all 77 miles of shoreline.
The project, which spanned four years, entailed two accurate orthoimagery and lidar collections, data processing and analysis, and myriad feature extractions for environmental management purposes.
Seeing the Need
Sean D. Rafferty, research director and associate director for PASG at Penn State University, said the origins of this Mapping of the Lake Erie Watershed project go back to 2010-11, when PASG began collaborating with PADEP to acquire better resolution data.
“We wanted to utilize these geospatial data to make more informed decisions regarding water quality issues,” Rafferty said. “We’ve been working on watershed planning, identifying needs in the watersheds and where best to allocate resources.”
Woolpert was brought in to collect the first swath of 6-inch, four-band aerial imagery and 1.0-meter Nominal Pulse Spacing (NPS) lidar in 2012. In 2015, a second set was collected. This was 6-inch, four-band aerial imagery and 0.7-meter NPS lidar collection. PADEP then sourced the data needed for subsequent natural feature mapping and inventorying.
The project involved the collection of near-infrared imagery in the 833-920 nanometer range and airborne topographic lidar at 1,064 nanometers. This method provided additional information for deeper analysis.
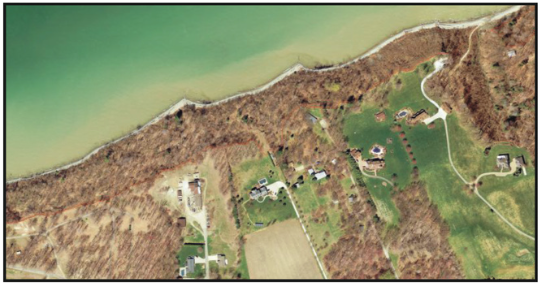
An extracted elevation line shows the Lake Erie coast bluff line.
Accomplishing two data collections in a relatively short period of time allowed Woolpert to perform comparative data analysis to calculate shoreline erosion modeling (that had been historically performed manually) and provided deliverables that included impervious surface mapping, hydrographic mapping, watershed delineation, shoreline mapping, bluff crest delineation, and total bluff change.
By analyzing and comparing the two sets of data over the course of three years, the state could track key aspects of environmental and natural resource management. This led to the most complete picture that Pennsylvania has ever had of the Lake Erie watershed.
Impervious Surface Mapping and Stormwater Management
Materials that prevent the infiltration of surface water to underlying strata–like buildings, asphalt, blacktop, driveways, parking lots, pavers, and compacted earth–keep water from being naturally absorbed and filtered.
Increasing the area of these impervious surfaces results in runoff and siltation, which degrades stream habitats for aquatic and amphibious animals.
To ascertain the extent, nature, and potential impact of impervious surfaces in the watershed, which had been an unknown variable prior to this project, Woolpert delineated and mapped the impervious surfaces throughout the entire watershed.
The firm employed a semi-automated feature-extraction technique to perform object recognition and delineation of impervious surfaces from digital orthoimagery and lidar data, which produced preliminary data. Using scene reconstruction with least-squares optimization, the team minimized noise and fit objects to the scene. This was a quality assurance step, which created an accuracy of greater than 95%. Ultimately, these maps enabled users to measure and quantify impervious areas larger than 100 square feet.
Hydrographic and Shoreline Mapping
The Lake Erie Watershed bears the scars of millennia-old glaciation events. Repeat advances and retreats of ice sheets deposited fine-grained, poorly drained drift material on the surface of the southern portion of the watershed, resulting in irregular stream patterns. A series of ancient lakes in the northern area of the watershed left surface deposits of well-drained, sandy beach ridges. Together, these features present a complex and unique topographic challenge.
To accurately chart these structures, a watershed-wide hydrographic dataset was created that included rivers, lakes, streams, creeks, reservoirs, ponds, and swamps. It also included the direction of flow for running bodies of water.
A major challenge in mapping the watershed was the intricacy of its 40 major sub-basins. These basins were most recently delineated using 30-meter gridded data.
Woolpert’s high-density lidar, at 0.7-meter NPS, generated surface models with an unprecedented level of accuracy. It allowed the PADEP to better delineate watersheds representing the drainage basins of smaller creeks.
The surface models provided were used to perform stream-path and ridgeline analysis and to calculate drainage divides using an eight-direction pour point algorithm.
This outputted the flow direction at each location, along with a bottom-up approach for determining flow direction through flat areas and a custom algorithm for automatically filling depressions in terrain data. This method scaled well to the project and produced numerous watersheds over the 512-square-mile region. Rafferty said that hydrology supports multiple projects because the use of the data generated is infinite.
“Hydrology came up as part of this bluff delineation program,” Rafferty said. “We were looking at data to analyze bluff changes over time and delineate bluff crest lines, taking a modeling methodology and applying it to the tributaries in the shoreline.”
The Pennsylvania Lake Erie Watershed is required to locate the shoreline at 573.4 feet above sea level, which is the ordinary high water mark. Obtaining an accurate shoreline level is important for the state because it is used to determine an exclusion zone where bluff toe exists. It also was used to track the rate and extent of shoreline erosion between the two lidar collections.
Woolpert extracted a contour line at 573.4 feet and delivered this contour as the shoreline.
Bluff Crest Delineation and Recession Rate Analysis
PADEP is responsible for shoreline mapping and bluff management in Pennsylvania. Most of Pennsylvania’s 77 miles of Lake Erie shoreline consists of bluff geomorphologies ranging in height from 5 to 180 feet above lake level. These bluffs are steep-sloped, erosion-prone, upland systems that are major sources of sediment erosion in Lake Erie, and the phenomenon of bluff recession complicates lake-side development and land-use decision-making.
Municipalities that have bluff recession hazard areas designated within their boundaries are required to enact setback ordinances that impact construction and growth.
“We had to understand how the bluffs were responding to erosion,” said chief Tim Bruno, Office of the Great Lakes, PADEP. “Sea Grant and Penn State Behrend are completing a project to see where it’s eroding faster. But first, Sea Grant wanted to know where the bluff line was. We’re looking at water crest delineation. We wanted watershed boundaries to be determined.”
To assist the state with its ongoing control point monitoring system and surveying efforts, Woolpert designed a method of delineating bluff crests that provided an accurate and complete GIS inventory of the features in question.
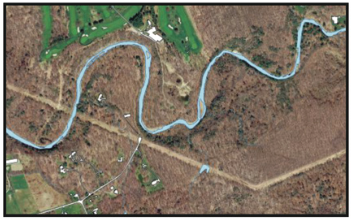
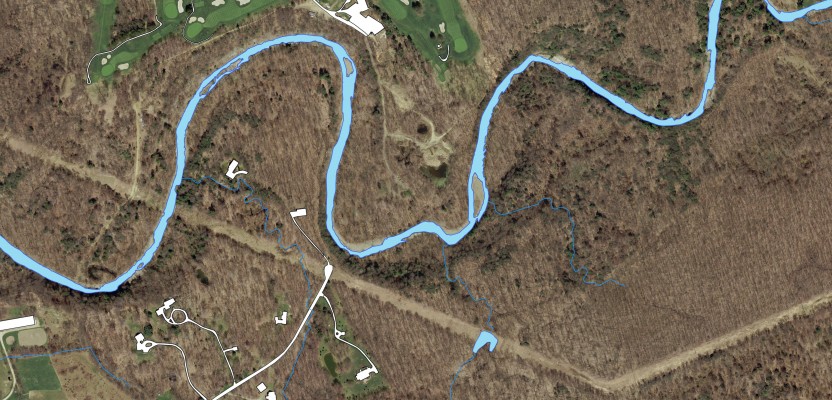
This hydrologic feature extraction is of a stream and associated drainage and creeks.
Since most of the shoreline was covered by vegetation, a filter was used to eliminate non-ground points from the raw lidar point cloud. Next, insignificant break lines were removed while the bluff crest was exaggerated. Then, the illumination values of each cell relative to its neighboring cells were calculated. These were used to identify the maximum change in elevation over the distance between cells. This information was translated to the imagery as a hillshade or a hypothetical illumination of the surface.
Finally, the maximum rate of change from each cell to its neighboring cells was identified. The steepest downhill descent, or slope, in the data was extracted. Woolpert then created a visual layer stack containing all input data sources–DTM, hillshade and slope–to perform a threshold analysis.
In order to extract the bluff crest line, Woolpert developed a rule set that analyzed the data and identified the bluff crest. The rule set was: Slope>38 degrees; Hillshade>184; Curvature>74; Profile<-3.
After delineating the bluff crest data from both the 2012 and 2015 datasets, Woolpert team members manually reviewed the records to perform a bluff recession analysis.
In the three years between collections, the Lake Erie bluff experienced 8,117.58 square feet of total advance and 705,325.98 square feet of total recession.
Importance of Accurate, Consistent Data
For watershed delineation prior to this project, Tim Bruno said PADEP had been working from previously created geospatial stream layers that weren’t representative of the watershed to the accuracy necessary.
“They were older collections, and that imagery was collected at a lower resolution,” Bruno said, “The new hydrodatasets provided by Woolpert to Pennsylvania Sea Grant show what’s going on the ground now.”
All of the data generated by the projects will be available for free and hosted on Pennsylvania Spatial Data Access (PASDA), the official public access geospatial information clearinghouse for the Commonwealth.
“We’re also developing a tool, a geospatial web mapping app, that will allow people to access these data,” Rafferty said. “The app will be featured on the upcoming Pennsylvania Lake Erie Water and Land Technical Resource website (WALTeR), which will be completed later in 2017.”
Bruno said the benefits of this data can and should extend beyond the Pennsylvania boundaries of the watershed.
“One of the things I’ve been more concerned about is the consistency and continuity of data as you go across the Great Lakes,” Bruno said. “Right now, states have different quality levels of data. The overall goal should be coordination of data across state and national boundaries so that informed, integrated management decisions are made by all the jurisdictions. An important first step is an evaluation of where each jurisdiction is right now in terms of geospatial data acquisition. What are their collection programs? What products and level of quality are they collecting?”
He said common standards of collection, both in timing and accuracy, would support this effort and allow the sharing of data between the eight state jurisdictions of the Great Lakes. This would advance the collective and common needs of the region, save time and money by preventing duplication of efforts, and promote collaboration, since the data would be interchangeable.