One company details mapping applications of airborne hyperspectral imagery for agriculture, forestry, and resource mapping.
By Patrick Burns and Scott Nowicki, PhD
Remote sensing imagery has been collected with many different camera systems for many different applications over the past 50 years of the industry.
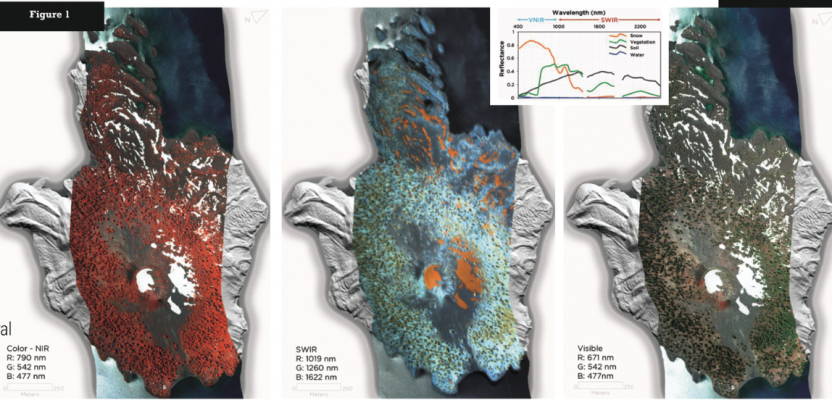
Visible remote sensing imagery provides interpretable information available to most users, primarily because it uses spectral wavelengths similar to what the human eye uses, for which the interpretation process is exactly the same. We collect the reflected energy from a scene, put it together into a color picture, and interpret the colors and patterns to identify recognizable features. As soon as we move beyond the visible red, green, blue (RGB) image, we take a step into a realm of interpretation that is beyond what our eyes and brains can initially achieve.
Four-band multispectral imagery (MSI) adds invisible near-infrared information that enhances our ability to differentiate features associated with the infrared reflectance of plants and therefore adds a new dimension of information to a scene. MSI data can be anywhere from four to as many as a dozen wavelengths of imagery, while hundreds of distinct wavelengths is squarely in the hyperspectral imagery (HSI) domain. With each additional band of information, the data dimensionality grows and increases the potential for discriminating specific materials based upon diagnostic spectral features.
For HSI data sets, visual interpretation is quickly surpassed by more advanced computer algorithms, like spectral mixture analysis or machine learning, which are capable of investigating the entire data dimensionality to recognize the presence of specific surface materials or atmospheric components. With the increase in data dimensionality comes a drastic increase in data volume, pushing the limits of ever-increasing storage drive sizes and processing power.
We work at Quantum Spatial (QSI), a company focused on turning geospatial data into meaningful information. HSI enables us to solve emerging problems in environmental monitoring, utility vegetation management, and resource mapping. The ongoing challenge, similar to other recent remote-sensing technologies, will be efficient processing and careful analysis.
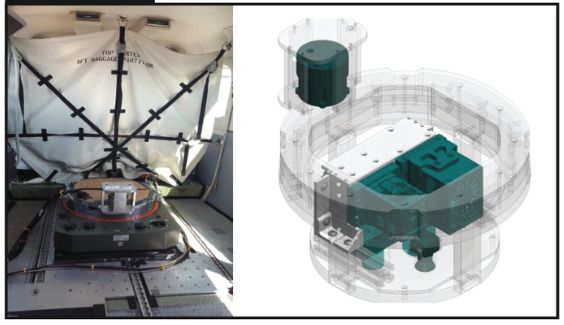
Figure 2: QSI VNIR+SWIR airborne acquisition system mounted in a manned aircraft. Two hyperspectral cameras are hard-mounted side by side with an IMU on a gyro-stabilized mount.
Acquisition and Data Processing
HSI data-collection requirements are similar to any airborne imagery collection. Data should be acquired when sun angles are higher than 30 degrees above the horizon in order to provide the sensor with sufficient reflected energy. Cloud cover should be minimal for consistent reflected energy. Flying heights will vary based on the specific sensor array dimensions.
In our case, we primarily use a Headwall E Series (VNIR, 400 to 1000 nm; 1600 pixels wide) coupled with a Headwall X Series (SWIR, 1000 to 2500 nm; 320 pixels wide). Both of these pushbroom scanners are co-mounted in a gyro-stabilized mount (Figure 2), typically in a Cessna Grand Caravan.
For a 0.5m VNIR pixel we cannot exceed 1800m AGL, while we’re limited to approximately 300m for the same SWIR pixel size. Given the disparity in pixel size due to smaller arrays, SWIR sensors (in their current state) may not be practical for every project. They’re better suited for smaller scale projects, such as precision agriculture surveys or vegetation management corridor surveys.
Another important acquisition consideration concerns geometric accuracy as a result of image synchronization with position and orientation data. Precise time synchronization between the inertial navigation system and image collection system is imperative. Seemingly slight temporal offsets can lead to multi-meter spatial pixel errors and the appearance of wavy flightlines following orthorectification. Figure 3 highlights the utility of precise time synchronization during a “rolly” calibration flight line.
The final processing consideration deals with one of quantitative remote sensing’s ongoing puzzles, atmospheric correction. For the sake of image consistency, atmospheric correction is essential for projects that span large areas with any terrain or a range of times (variable illumination conditions).
The goal of this correction routine is to produce an image with reflectance values that are consistent, in space and time, for the same spectrally invariant physical features. This step will be vital for multi-temporal imagery comparisons/compilations as we add to our data libraries.
HSI Uses
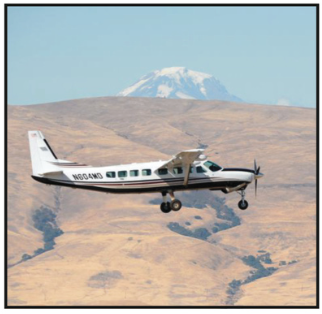
A Cessna Grand Caravan performs a survey near Hood River, OR.
QSI has used airborne hyperspectral data to provide solutions for a variety of applications and environments. Here, we highlight project examples from precision agriculture and forestry and also discuss potential resource-mapping applications, such as mineral mapping and detection of greenhouse gas leaks. In all of these applications, we focus on the problem-solving aspect of the projects rather than the scientific advancements–this is applied science.
Agriculture
The potential applications of HSI for agriculture have been well documented in scientific studies, but the benefits to farmers lie in highly specialized analyses tuned to solving problems that are difficult to assess on the ground from a farm-manager perspective.
Crop health is the most widespread use of spectral imagery for agriculture, but the most benefit is derived from determining the causes of crop health variations. For example, HSI data of crops with the right combination of field observations are capable of discriminating plant stress as a function of drought or pathogen. Equally useful is the detection of weed infestations in otherwise healthy crops.
We are currently testing a multi-temporal analysis using high spatial resolution VNIR+SWIR data sets to monitor the stress and vitality of various crops and orchard trees throughout the growing season and provide meaningful results to farm managers in an attempt to inform management practices in near real-time.
Forestry
Scaling up to larger vegetation, QSI has completed multiple precision forestry projects, both in urban and natural forests, to map tree type and stress. Pioneering hyperspectral efforts from the research community revealed that canopies of different tree genus/species have distinct reflectance spectra in the VNIR+SWIR region (Figure 5).
Additionally, HSI data can be used to estimate tree canopy stress using indices that relate to biophysical parameters, such as chlorophyll content, water content, and light-use efficiency.
Over the past few years, power utilities have relied on precise airborne lidar to detect trees along transmission lines that have the potential to cause outages. Vegetation management programs that use these precision data sets are finding significant decreases in costs for vegetation management as well as in risk of catastrophic outages. In California, a few key tree species have been found to be the dominant hazards, especially if they’re stressed.
The recent adoption of HSI in combination with lidar is changing the game for how vegetation is managed in order to reduce outages. In the eastern U.S., species-specific pest-induced stress (i.e. emerald ash borer) is proving to be a dominant vegetation-management hazard as well as a problem in municipal landscapes.
QSI performs most spectral analyses at the pixel scale and then aggregates this information to the individual tree level. Individual tree crowns can be separated from one another in an automated fashion using either image-derived or lidar point-based segmentation routines. Segmentation and pixel-to-polygon aggregation are very important steps, again highlighting the importance of time synchronization and precise orthorectification, preferably with a lidar-derived elevation model.
Using machine learning algorithms, we’ve classified individual tree type with overall accuracies that typically range from 80 to 90%. In one instance, working across six different areas in California’s Central Valley and Sierra foothills, we classified tree genus/species (between 7 and 12 total classes per area) with overall average accuracies ranging from 78% to 90%. Across the country in Louisville, Kentucky we classified the city’s dominant tree types (Ash, Maple, Oak, Other Broadleaf, Conifer) with an overall accuracy of 83% (Figure 5).
In airborne remote sensing, the concept of plant health can be interpreted differently depending on the definition or the perspective from which a plant is assessed. From the airborne perspective, flying between 300 and 1500 meters above ground level, we’re able to observe stress from only the top of the canopy. While the condition of the canopy is usually a good proxy for the overall health of a tree, additional criteria used by arborists are much more subjective to assess, such as root conditions, soil quality, and lesions. Due to the discrepancy between remote sensing and ground observations, it’s difficult to assess the overall accuracy of a health classification.
For a mostly coniferous forest in the Sierra Nevada, we used 3-inch aerial imagery to identify training and validation trees across three levels of stress. We then classified each tree in the entire area with greater than 85% accuracy.
This same task becomes much more challenging when working in more mixed forests or when trying to use ground-collected tree health points for classification training and validation. We’ve learned that different leaf structure and overall tree form can impact health assessments. In order to account for these effects, in some locations we are running our health assessment separately for each tree type.
One of the most costly and challenging components of any forest type and health classification is ground truth data collection. It’s expensive to send crews out to the project area, more so for small projects. An ongoing challenge for any type of HSI classification effort is quantifying the minimum number of training and validations points needed for robust class separation.
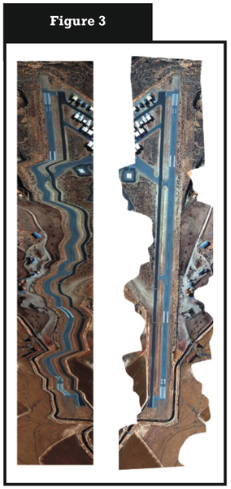
A wiggly flight line over the Susanville, CA airport. The left image shows the raw, unrectified imagery during a flight line in which the pilot rolled the wings back and forth.
Resource Mapping
Potential applications in hyperspectral analysis are being developed in areas where either a new acquisition methodology or a combination of data sets can lead to new approaches to mapping and anomaly detection. HSI is sensitive to the spectral features that are diagnostic in differentiating soil minerals (mostly hydrated and oxidized minerals) and hydrothermal alteration products.
NASA airborne instruments like AVIRIS have been used for decades to do spectral mineral mapping primarily focused on hydrothermal alteration associated with mining, but many different projects have been flown and studied around the world. Typically these scientific community instruments have been flown at relatively high AGL to produce datasets in the 5 to 50 m GSD range.
The QSI HSI system is often flown much lower, to produce very high spatial resolution imagery with pixel sizes ranging from 0.5 to 2 m. The results can be stunning, with datasets capable of distinguishing surficial geologic units that are only a few meters in scale (Figure 6) and often indistinguishable in the field.
A key concern for many previous geologic studies has been sub-pixel spectral mixing that requires a mixture analysis approach in order to obtain pure mineral or material spectra. For many lithologies this problem is resolved when using fine spatial resolution (1 – 5 m) HSI imagery.
With the increasing impacts of atmospheric greenhouse gases (GHG), especially methane, monitoring large areas using high resolution HSI has moved to the forefront of regulatory possibilities. We have known for decades that GHG concentrations in the atmosphere can be measured, but the focus now is on identifying and fixing leaks in natural gas infrastructure and in the oil and gas fields. Methane has a handful of distinct spectral absorptions in the SWIR, MWIR, and TIR spectral regions, each of which can be exploited using HSI.
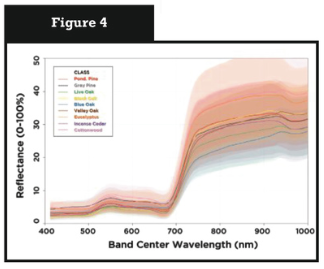
Observed VNIR spectral variability in tree genus/species VNIR spectra from a project in the Sierra Nevada foothills.
Currently operating airborne systems are often too coarse of resolution to be able to pinpoint the locations of small gas leaks, and a new low AGL approach is needed to make these systems more applicable. The utility of this application was highlighted during the Aliso Canyon leak, the largest documented gas leak in history.
NASA’s AVIRIS system was able to collect data fine-scale enough to detect and map the extent of the Aliso Canyon leak in Southern CA, even though the spatial resolution was still coarse relative to the features. This system operates in the same wavelength region as the QSI HSI system. Small-scale airborne leak detection is becoming a reality with the right combination of spatial resolution and spectral sensitivity.
Data Trends
Data fusion and multitemporal analysis are also leading to new approaches and solutions. Hyperspectral data can be combined with other data types, such as high-density lidar, to determine distinctly different characteristics about a scene. For example, NASA’s Airborne Snow Observatory is combining repeat snow depth measurements from lidar with snow albedo measurements from VNIR HSI imagery to improve snowmelt forecasting in the Sierra Nevada.
Regarding one of the examples highlighted here, we see great promise in adding lidar spectral and structural components to tree type and health classifications. We also expect the temporal dimension to play a larger role in answering more challenging questions, especially those that pertain to dynamic landscapes and life forms.
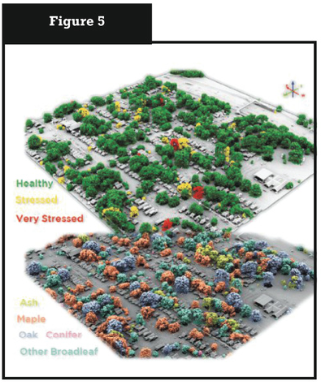
Lidar perspective from Louisville, KY colored by tree health (above) and type (below).
For example, we’re able to plot consistent health metrics for crops and individual trees over different time periods, from multiple scenes in a single agricultural growing season to annual assessments during multi-year droughts. In the case of trees, multi-season to multi-year surveys will permit health derivative analyses that allow us to look at health trends over time and make better predictions about future tree mortality and risk.
We expect multi- to hyper-temporal hyperspectral analyses to increase with the use of unmanned aerial systems and the continued development of lightweight HSI payloads. This is already the case in the precision agriculture field as many repeat UAS surveys are conducted at local to regional scales throughout the growing season.
By this point, the trend toward increasing the amount of data is obvious: higher spatial resolutions, hundreds of spectral bands, fusion with other data sources, and multiple repeat observations. Many complex geospatial problems will require a combination of these different components in order to provide accurate and valuable solutions.
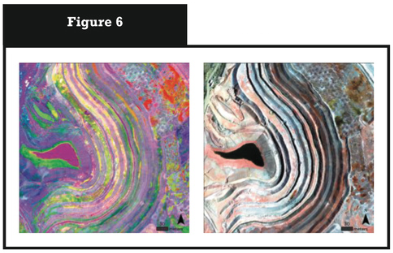
HSI from Pinto Mine, AZ. The left image shows a principal component transformation used to distinguish minerals on the surface; the right image shows a visible image at 0.5m spatial resolution.