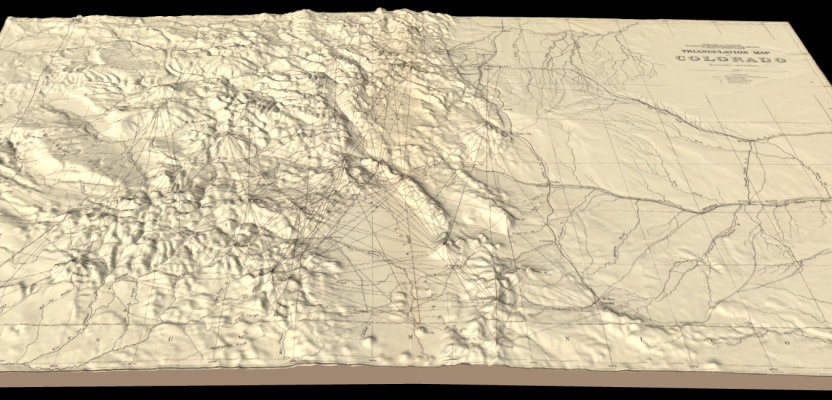
Above image: Hayden’s triangulation survey map is overlaid on a digital elevation model.
A GIS project visualizes the fascinating triangulation network created for the historic Hayden survey of Colorado.
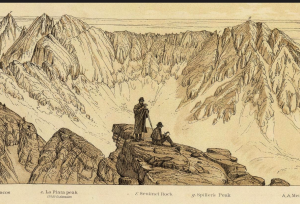
An inset from Hayden’s Atlas shows surveyors at work in the mountains of Colorado.
One of the great surveyors in the American West is undoubtedly Ferdinand Vandeveer Hayden. A physician during the Civil war, he rose to be chief medical officer of the Army of the Shenandoah. After the war he was appointed geologist in charge of the United States Geological and Geographical Survey of the Territories.
Hayden spent the next few summers in the west surveying the areas around Yellowstone and the Grand Tetons. His annual reports caused excitement in Washington as they described stunning mountains, roaring rivers, boiling hot springs, geysers, and exotic natural pools.
When Hayden returned to Washington he fervently lobbied for the creation of Yellowstone National Park. It was established as the first national park in the United States by President Ulysses S. Grant in 1872.
Mapping Colorado (1873-1876)
In the post-war United States there was great fascination and ambition about Colorado. Horace Greeley, the journalist who is credited with the saying “Go West, young man,” traveled to Colorado and inspired masses more to come. The 1860s saw gold rushes near Pikes Peak and Central City. Denver was connected by two railroads and became a boomtown for a decade.
However, Colorado was not properly mapped. Hayden’s new focus was to create an atlas of the Rocky Mountains. He had created maps of the Yellowstone region, but he wasn’t satisfied with their quality. He wanted to make maps of Colorado using all the latest scientific knowledge and techniques of the 19th century.
The survey was painstaking work. A six-mile baseline was established near Denver, and it was crucial that this measurement was precise. In his 1873 annual report Hayden wrote:
“The system of triangles rests upon a base about six miles long near Denver. This was twice measured with a steel tape under twenty pounds strain and the temperature taken every five minutes. A check-base will be measured this year. A secondary triangulation, resting upon this primary, was carried by the topographers over the same area. The primary triangles range from thirty to sixty miles in the length of their sides, while the secondary average eight miles.”
From the Denver baseline the surveyors would use their transits to take readings on nearby mountain peaks. On the summits of those peaks cairns were placed as monuments to turn the transit upon. If they were too far away, the peak would be used for the sightings. In this way a primary triangular network was created based on the six-mile baseline.
An additional problem facing the surveyors was getting the correct elevation. One method to do this before GPS was to use barometers. Barometers on their own aren’t precise, so weather stations were set up around the state at locations with known elevations. When surveyors would reach peaks of unknown elevations they would take barometric readings, many every day, sometimes over a period of several weeks. At the end of the season the barometer readings were compared for a more precise elevation.
For example, the Hayden survey used barometers to determine the elevation of Long’s Peak. They calculated it to be 14,271 feet high. Modern survey techniques put Long’s Peak at 14,259 feet high (NAVD88).
In addition to using barometers, where possible the surveyors ran levels to the tops of mountains. This depended on having a starting point to measure from, and that usually meant a nearby railroad.
By the mid-1870s most of the railroad depots around Colorado had fairly accurate elevations. This data was derived from railroad engineers who had run levels along their lines. America at the time was crisscrossed by a network of many competing railroad companies, and this data could be cross-referenced to get a better idea of the elevations in remote locations.
There were discrepancies among this data, though. Hayden’s survey geographer James T. Gardner combed through field notes and reports from railroad engineers to tighten the elevations and get a better value for Colorado elevations. All the data was linked to the elevation of the Kansas Pacific railroad depot in Denver, and therefore it was crucial to get this particular elevation right.
Group Effort
Across the state important geographic work was getting done. In 1874 a civil engineer at the behest of the war department had run levels from the Colorado Springs train depot to the top of Pike’s Peak. In addition, the United States Coast Survey set up astronomical stations to get precise latitude and longitudes for the Hayden survey.
Over several summers the survey was divided into six or more groups working far apart. The groups had about a dozen men, including a topographer, a geologist, cooks, and other assistants. In addition, a quartermaster would roam Colorado to bring food and supplies to the crews.
The triangulation work was led by the geographer James T. Gardner. Gardner performed careful and detailed work in preparing the survey. His team used theodolites, survey chains, and transits with powerful telescopes.
Hayden Atlas
After returning to Washington, Hayden and his lieutenants went about making the atlas. In 1877 the Hayden atlas was printed by the lithographing firm of Julius Bien and Company.
German-born Bien came to America as a young man in 1848. His exceptional lithograph work mapping railroads in the west propelled his career and garnered the attention of powerful men in Washington. By the time of the civil war Bien’s company was one of the top mapping firms in the country.
Lithography at the time was meticulous work. The process involved etching the map on a smooth stone surface. The best of these stones, and likely the ones used by Julius Bien’s company, are a special limestone from a quarry in Bavaria.
The etching must also be done in an exact mirror to transfer it correctly to paper. The etched lines are filled with a kind of grease that contains the ink. When paper is pressed to the stone, the ink will apply to the paper only where the lines were engraved.
The atlas immediately gained significance in the development of Colorado. It included many maps describing economic possibilities, drainages, geology, and topography. It was owned and used by railroad barons, territorial governors, bankers, and explorers.
3D Visualization
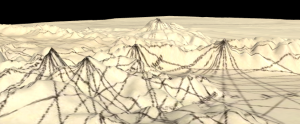
Details from the map showing the transformation into 3D.
 My main interest is the triangulation map from the atlas. This is a fascinating work: a visualization of the science of cartography. My goal was to take this flat map and overlay it onto a digital elevation model. Doing this gives it texture and shows the terrain that made this triangulation possible.
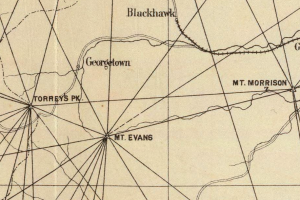
I started with a high-resolution copy of the map from the David Rumsey Map Collection. The map is detailed and contains a coordinate grid along with all the peaks used in the network.
This is convenient because my next step was to georeference the map within QGIS software. Georeferencing is the process of taking an image and assigning coordinates, like assigning ground control points to points on the image to give the image a geospatial reference.
I started with the four corners of the (un-referenced) map; this was easy because there were coordinates on the border of the map that I could reference to the coordinate system I was using in QGIS. I took the nearest grid intersection and assigned it the coordinate.
After that, I georeferenced the peaks on the map. Places like Pikes Peak, Mount Peale, Mount Evans, etc. have known coordinates that are easy to look up. I obtained coordinates on places distributed somewhat evenly around the map.
QGIS, using the referencing that I provided, then stretches the map to fit the reference automatically. It performs mathematical functions and puts the image on a map using one of the possible methods (Linear, Helmert, Polynomial, Projective).
Next, I added a digital elevation model to the map. I downloaded the 30 arc-second dataset from the USGS (GMTED2010) and dropped that into QGIS. That produced an elevation layer and an image layer.
Lastly, I use a QGIS plugin called Qgis2threejs. This plugin takes the 2D map and allows the 3D elements to be viewed in a webpage that you can use in your browser. Then you can use your mouse to zoom around and rotate the image (see xyht.com/spatial-itgis/adventures-3d-gis/).
I exaggerated the size of the mountains to give them more emphasis. They aren’t accurate, but they are all scaled at the same level. Now you can zoom onto the map and get an idea of what the terrain looks like from a given location. Go ahead and explore Pike’s Peak or Mount Evans and imagine what it was like for the early pioneers who were mapping this new frontier. You can really visualize it with this new map.
The visualization is at petrarch1603.github.io/colo-triangulation/
Suggested Additional Reading
- Hayden’s Landscapes Revisited – An online work from the University of Colorado that locates the places where sketches of the survey were made and compares them with modern day views.
- Great Surveys of the American West Richard A. Bartlett (1962)
- Triangulation Map of Colorado – Hayden, F.V. (1881) From the David Rumsey Map Collection
https://www.davidrumsey.com/luna/servlet/s/75g297 - [Seventh] Annual Report of the United States Geological and Geographical Survey of the Territories, embracing Colorado: being a report of progress of the exploration for the year 1873 (PDF) – by F. V. Hayden