On the rise are both interest and integration of processes—involving surveying, engineering design, and construction automation—into BIM workflows.
Editor’s note: We can discuss BIM theoretically all we want, but we realize that, for many folks, the concepts might seem abstract until people see real-world examples. So we’re pleased to present the following project from a prominent transportation entity in Italy.
BIM information from survey and design data can be a great source of information for construction supervision, operations, and infrastructure maintenance. Typically, this information is needed in the form of GIS as it requires data from and involves other buildings, infrastructure, and stakeholders.
Autodesk and Esri are collaborating to provide improved customer experiences, putting data at the center of the process so that teams can work with both GIS and BIM data. The new abilities include providing native and live access to BIM information within a GIS environment and—conversely—providing the same native and live access to GIS information within a BIM environment.
In this context, Italferr, together with Esri Italia and Autodesk, have developed solutions based on the ongoing integration of ArcGIS and Autodesk platforms. The project began in September 2017 with a multidisciplinary team of people from all three companies (Marcella Faraone, Ilaria Mascellani, and Stefano Libianchi from Italferr; Annunziata Visaggio, Laura Pesce, and Barbara Flamini from Esri; Paolo Quadrini, Stefano Toparini, Gabriel Narino, and Mattia Firinu from Autodesk).
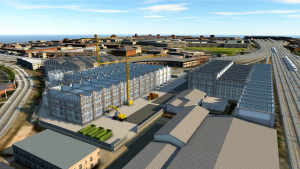
Firenze Romito buildings: Construction site model.
Italferr
Italferr is a company in the Italian State Railways Group, Ferrovie dello Stato.
Italferr has 34 years of experience at the cutting-edge of engineering in Italy and overseas, with large-scale infrastructure projects in both conventional and high-speed rail sectors as well as metropolitan and road transports.
The Italferr team that works with Autodesk and Esri is called The Competence Center (CC) BIM – GIS, under the Strategy and Innovation Office in Italferr’s IT department.
The CC BIM – GIS has been supporting the introduction of BIM in Italferr since 2012 and has been involved in BIM management and BIM coordination activities for Italy’s Red Line North Underground project in Doha since 2014. Currently, the main objective of the team is the research of new technologies and innovative workflows to support the core activities of Italferr: the engineering design and construction site management and supervision.
Workflow
The workflow among the Esri and Autodesk platforms represent the lifecycle management of the Brescia Tramway project.
A workflow has been created using Esri’s GIS platform and the BIM model designed with Autodesk software used throughout the entire infrastructure lifecycle management, starting from feasibility and concept design to handover and asset management.
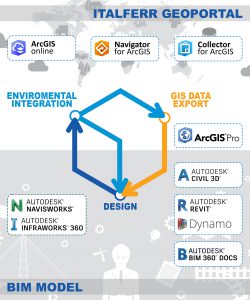
The starting point of this workflow is the Italferr Geoportal, where team members can share all the geographical information such as geological surfaces, maps, surveys, environmental constraints, and data from projects—especially if designed in BIM.
The integration of the BIM model into the environment can take advantage of the potential of GIS analysis, especially for linear infrastructure projects such as railways, roads, and metropolitan and tramway lines.
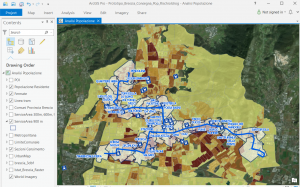
The figure at left shows an example of the workflow elaborated to simulate the entire lifecycle management of the Brescia Tramway project (a city in the north of Italy).
The process starts with the GIS analysis for feasibility design for the linear infrastructure. The geographical data is exported from the Geoportal and imported into design-authoring tools for the first draft of the alignment (feasibility design).
The draft of the alignment integrated into the environment allows the team to proceed with 2D GIS analysis (hydro/geological risks, demographic and network analysis, geological surveys, and interferometric data from satellite analysis). The results of these analyses are followed with a review of the project and a new revision of the design.
The process continues with a continuous exchange of data (GIS Data Export Design Environmental Integration Design) during the following project phases: the concept design and the detailed design.
The integration of the BIM model into the environment is fundamental also for a 3D coordination process. This helps designers and coordinators to solve not only all interferences and clashes among structural, architectural, and MEP (mechanical electrical and plumbing) elements, but also interferences with underground utilities, existing buildings, etc.
During pre-construction and construction phases, the integration supports all the involved stakeholders so they can effectively plan the work and choose in an optimal way the construction sites used for the network analysis.
When the workflow is applied from the beginning of the project, team members can effectively monitor and plan both expected and unexpected maintenance of the entire infrastructure during the facility management phase.
Italferr is currently implementing these modernized workflow enhancements with the Brescia Tramway project, from concept design to facility management—a proof of concept, but also an active project.
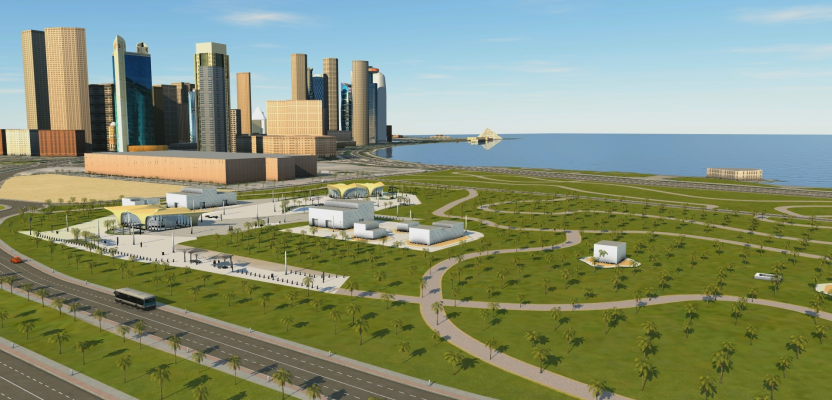
Brescia Tramway: A view of the tramway model in the environment.
Feasibility and Conceptual Design
During the feasibility and concept phases are relevant 2D analyses for the design of railways and metropolitan or tramways.
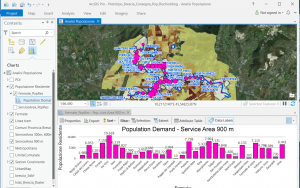
Demographic and network analysis are fundamental for decision making. The input data of the GIS analysis to calculate the demand-side management in transport of Brescia are 2D tramway alignment, geocoded tramway stops, and ISTAT census blocks symbolized by the total resident population.
With the ArcGIS Network Analyst extension, it’s possible to locate service areas within 900 meters around any stop of the alignment. Once service areas are created, with the spatial analyst tool it is possible to calculate how many people live within that area with spatial intersection between census block and service area polygons. In that way it is possible to calculate the total demand of transportation for all the stops.
Decision making: a choice of stops is created through a spatial intersection between the census block and service-area polygons for population demand.
Detailed Design
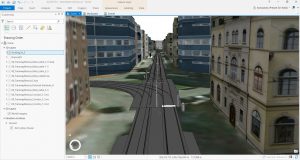
How can merging the data from the environment and the BIM model be useful during the detailed design phase of an infrastructure project? The following is an instructive example regarding underground utilities such as water, sewer, and public lighting systems that reveals the strength of this integration.
The first step is to individuate the intersection between the tramway and the underground utilities through Esri ArcGIS Pro tools. Then, the use of the tool Feature to 3D By Attributes allows us to create 3D features from 2D utilities layers using depth values derived from the attribute of the input features.
This data can be used in a BIM authoring software like Autodesk Revit to design, for example, the connections of MEP of a station or a building with public water and sewerage.
The same data will be used for a 3D coordination using software for clash detection such as Autodesk Navisworks. The interference analysis can highlight clashes between the infrastructure and the utilities pipes.
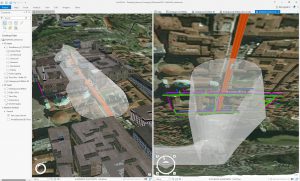
Intersection between the buffer 3D area around 50 meters from the corridor (BIM model) and the underground utilities (water, sewer, and public lighting).
Pre-construction and Construction
The surveyed and mapped 3D data of the utilities can be used to more efficiently plan the work. During the infrastructure construction, the utilities pipes that intersect the alignment may need to be encased to avoid structure damage.
In order to Involve all the stakeholders responsible for the maintenance of the utilities, the 3D buffer tool can help to individuate the type of service intersected and calculates the length of the pipe to be reinforced.
The same data can help to find the best place for the construction site that needs to be connected to public water, sewer, and public lighting systems.
The construction plan and the construction site choice could be made more effectively with the use of other types of analysis: the network analysis for managing alternative routes during the work or for waste management and goods storage.
Because the construction site stops traffic flow, a network analysis can be used to schedule viability while the construction site progresses along the line.
Another example of network analysis useful for deciding the best way to go from a construction site to a waste management site and depot site is to choose the best and most sustainable route.
Facility Management
The use of our workflow integrating BIM and GIS from the beginning of the project allows us to have all the data essential for effective maintenance.
Geographical data and BIM project data should be uploaded in a common data environment in a cloud platform like Autodesk BIM 360 and published in a GIS cloud platform like ArcGIS Online.
In this way, the data can be shared through BIM 360 and ArcGIS apps, which allows teams distributed throughout the territory to communicate.
In the proof of concept of the Brescia tramway project, BIM 360 has been chosen as a common data environment, and all the project data have been published on ArcGIS online in order to provide access to a spread-out team.
From ArcGIS online it is possible to share all data with the apps ArcGIS Navigator and ArcGIS Collector. In case of both expected and unexpected maintenance, work orders will be created sharing the point of interest as Route Layer tool points with Navigator for ArcGIS.
The web address of the Route Layer will be shared by email to teams in the field (automatically or manually, depending if it’s unexpected maintenance). The ArcGIS Navigator app allows you to reach the asset to be checked with the best route.
Once the asset to be checked has been reached, the operators can click on the element that is published on the map to visualize the BIM model inside the Autodesk BIM 360 platform and the element with all the information necessary for the maintenance (device type, technical specification, etc.).
BIM Promises
Ongoing data maintenance, facilitated by such integrated processes, enables all elements, mapped and surveyed throughout the workflow, to contribute to updated BIM models. The ability to develop and work from a “digital twin” of the designed infrastructure provides a model with which to test alternatives and avoid major design changes.
This all provides a constant feedback loop, critical in the construction phase to reduce change orders and construction delays and cost overruns. Furthermore, this enables efficient facility operations and maintenance. These are the key promises of BIM.