Avoiding damage to utility infrastructure could save billions.
This is a summary of a white paper “Reducing Damage to Underground Utility Infrastructure during Excavation” prepared by Geoff Zeiss and Dr. Sakura Shinoaki and published by the Geospatial Information & Technology Association.
Over two decades in the United States there have been more than 400 fatalities and nearly 2,000 injuries attributed to hitting underground infrastructure during excavations. For comparison, over the past 20 years in this country, there have been about the same number of fatalities (403) resulting from major commercial airline crashes, excluding 9/11. In addition, inaccurate and missing information about underground infrastructure increases the risk of construction project schedule and budget overruns.
Comparing the United States and Japan reveals a startling difference in the number of incidents of underground utility damage during construction. In the United States the number of incidents is between 400,000 and 800,000 per year. In the Netherlands there are over 41,000 incidents annually. For Japan the number of incidents in 2016 was 134. Clearly something can be done to reduce the risk for construction workers and the public.
Underground utility damage is expensive. Several jurisdictions have attempted to estimate the cost of individual incidents and for entire national economies. Costs can be broken down into direct costs and indirect and social costs. Direct costs include the costs of sending a crew to repair the damaged pipe or cable. Indirect costs include many factors that are often hard to quantify such as traffic disruption, injuries and fatalities among workers and the public, and losses that local businesses experience.
Research at the University of Birmingham in England has estimated that indirect and social costs are 29 times direct costs. This leads to the important conclusion that underground utility damage represents a major drag on national economies, up to $100 billion annually in the United States alone.
The need for accurate maps
Government agencies and construction firms are recognizing that accurate models of underground infrastructure bring practical benefits to construction projects. For example, a consulting firm hired to study the Sydney (Australia) Light Rail Extension project concluded that if a reliable 3D map of underground infrastructure had been available during the planning stage, the project could have been completed at least 18 months sooner.
The Alabama Department of Transportation saved $10 million by using 3D modeling of underground utilities on a major highway interchange project. The Expo Milano project (built for a 2015 World Expo hosted by Milan, Italy) estimated that it saved about €16 for every €1 invested in improving the information about underground infrastructure. For a highway revitalization project in Cedar Falls, Iowa, a 3D model of underground utilities was created before design began and 200 utility conflicts were found prior to construction, enabling the project to be completed on schedule and 3 percent under bid.
These examples show that an accurate model (preferably in 3D) of underground utilities can not only reduce the risk of underground utility damage and associated delays and cost overruns, but can also reduce the cost of infrastructure by eliminating unnecessary and costly moving of utilities.
Subsurface engineering
Return on investment (ROI) studies of subsurface utility engineering (SUE) surveys applied to highway construction projects conducted since the late 1990s have consistently revealed a large ROI. One of the first, by Purdue University in 1999, estimated that requiring SUE on highway construction projects would result in at least $1 billion in savings annually. The most recent analysis for the Pennsylvania Department of Transportation (PennDOT) estimated $11.39 in savings for every $1 spent on SUE.
The study also showed that the greater the complexity level of buried utilities, the higher the SUE benefits. The largest contributor to the cost savings from SUE was a 40.33 percent reduction in relocation costs by providing accurate underground utility information in the early stages of design.
Advances in technology
In the last few years advances in ground-penetrating radar (GPR) have made it possible to safely capture scans at roadway speeds. One of the important challenges of GPR is interpreting the scans, which has required a trained geotechnician. New software developments are simplifying interpretation of these scans, enabling surveyors and other professionals to use GPR technology effectively.
Lidar is being applied to efficiently capture the location of newly installed underground pipelines. The simultaneous capture of above- and below-ground scans using Lidar and GPR creates a complete assessment for construction projects. Inertial mapping can be used to map underground pipe networks for up to two kilometers. Advances in acoustic locating show the technology can be effective in detection of underground objects down to 30 feet.
A major challenge has been the cost-effective capture of the location of new infrastructure as well as underground utilities exposed during construction. Recently, a reality capture solution has been developed that enables the creation of accurate as-builts from a video taken with an Android smartphone.
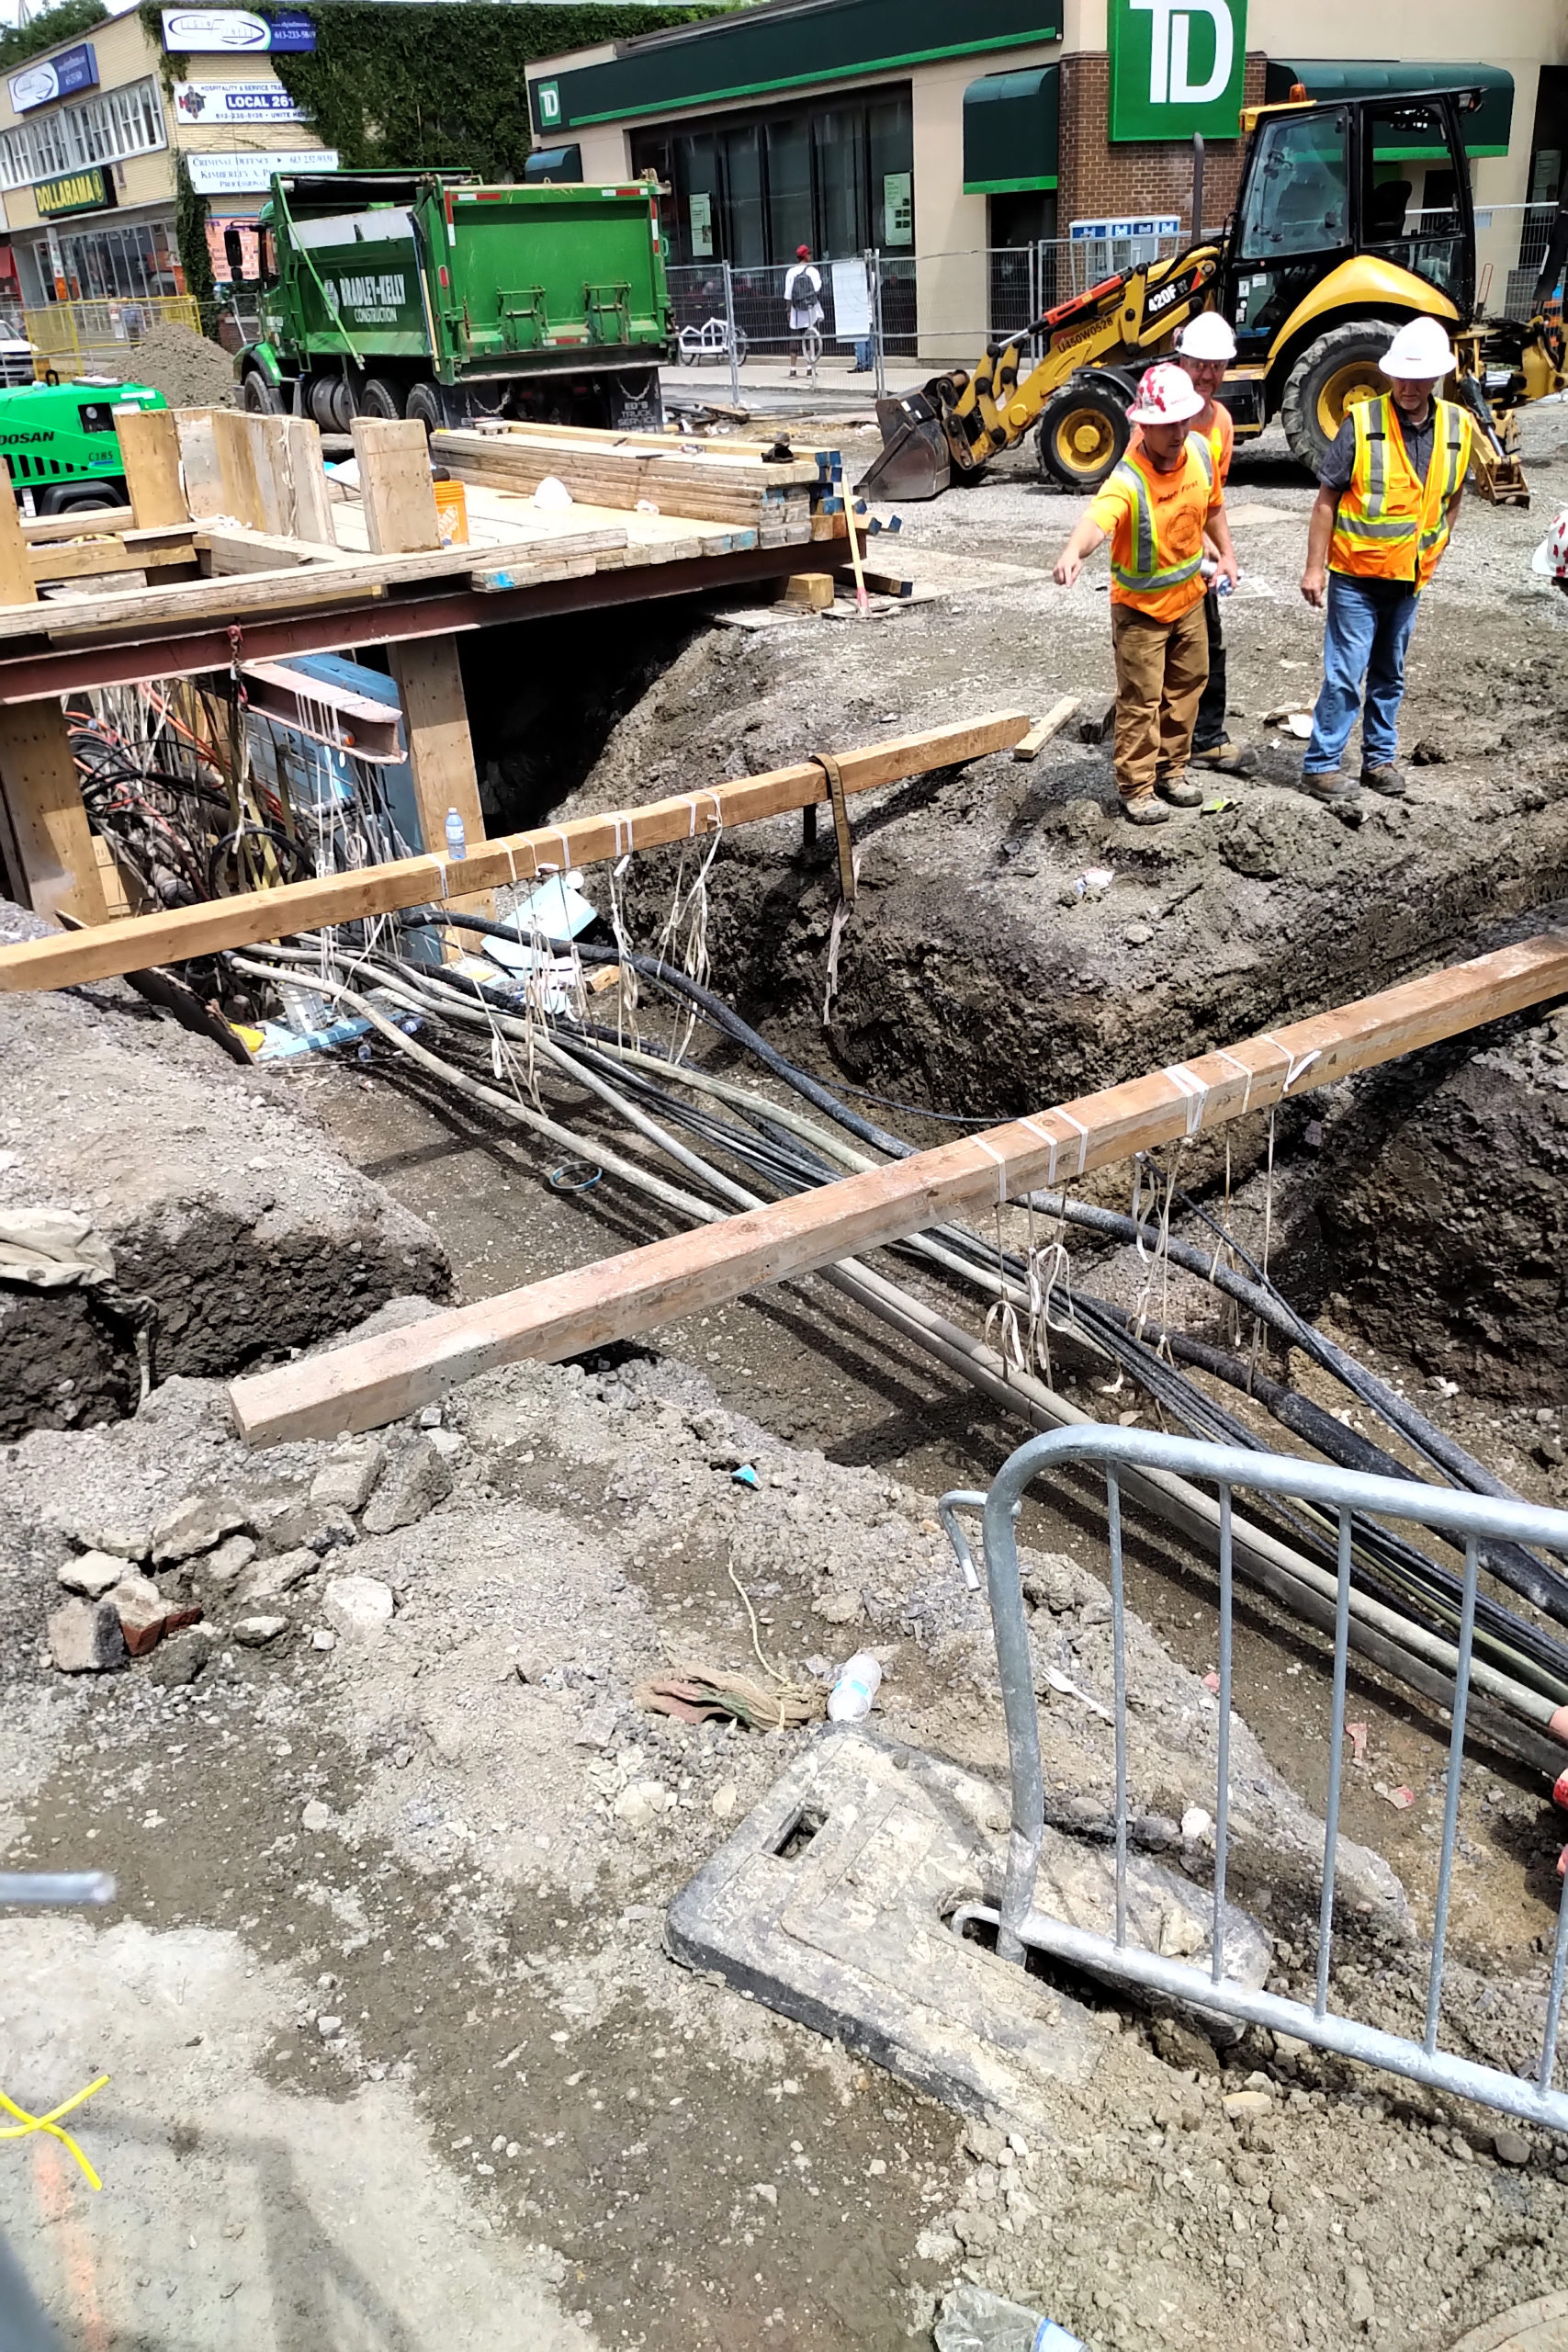
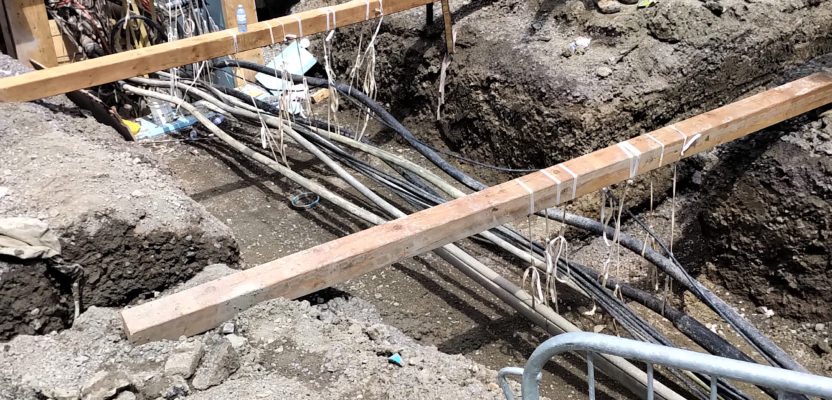
Underground utility infrastructure is often
in harm’s way during construction projects, costing economies around the world billions.
Using a local RTK base station or accurately surveyed control points, a video captured with a smartphone by walking along an open trench after installation of a new utility, allows as-builts accurate to plus-or-minus five centimeters to be generated. A similar process can be used for utilities exposed during construction to correct or augment existing records.Mixed reality applications for visualizing underground utilities on mobile devices are increasingly being deployed to the field. These not only enable visualizing above- and below-ground infrastructure, but also allow accurate measurement of positions and distances between objects. Visualization applications make it possible to integrate traditional BIM, CAD, GIS and other types of data into augmented reality visuals. Existing 2D and 3D records and site investigation results can be integrated in a 3D model that can be visualized in augmented reality on a handheld.
Online systems for sharing information about the location of underground infrastructure with stakeholders in construction projects have been implemented by several jurisdictions. The Colorado Department of Transportation adopted a hybrid online system that incorporates elements of survey and GIS technology and practices and enables the sharing of information about underground utilities among CDOT, network operators, and construction contractors with smartphones and other devices.
In Montana, the online Utility Permitting Administration System was rolled out by the state’s department of transportation in January of this year. Since then the location of all new underground infrastructure in the state right-of-way has been captured online. Maps of underground utilities and other information are available over the web to any device with a browser, including mobile devices.
Developments in Standards
Standards relating to locating and mapping underground infrastructure are advancing rapidly. The American Society of Civil Engineers (ASCE) is nearing completion of a new quality “Standard Guideline for Recording and Exchanging Utility Infrastructure Data” (also referred to as the utility as-built standard) to complement ASCE 38-02. A new revision of the British quality/confidence standard PAS 128 is also nearing completion.
The Open Geospatial Consortium is forming a Standards Working Group (SWG) to complete the “Model for Underground Data Definition and Integration” (MUDDI), which is intended to provide an open standards-based way to share information about the underground.
Underground damage assessed
Reliable metrics make it possible to assess the social and economic impact of incidents and the effectiveness of new technologies and policies in preventing and reducing the severity of underground utility damage incidents. While many jurisdictions have attempted to address the problem of damage to underground infrastructure during construction, only a few have managed to capture reliable statistics that can be used to assess the effectiveness of damage reduction programs.
In North America the Common Ground Alliance (CGA) has been collecting voluntarily submitted statistics since 2003. The latest CGA DIRT Report for 2018 concluded that progress in the U.S. in reducing damages has plateaued. Damages per million dollars of construction spending is actually increasing.
Statistics on incidents of underground utility damage from the Ontario Regional Common Ground Alliance (ORCGA) 2018 DIRT Report reveals that the damage ratio (number of incidents per 1,000 one call notifications) has been gradually increasing since 2014.
In the U.S. it is mandatory to report incidents of pipeline damage to the Pipeline and Hazardous Materials Safety Administration (PHMSA), which is responsible for federally regulated gas and hazardous liquids pipelines. PHMSA has implemented policies and regulations to improve pipeline safety. However, PHMSA’s statistics have not revealed a trend toward a reduction in pipeline incidents, including those attributed to excavation damage.
Liability for utility damage
It has been argued that liabilities may be the single most important key to improving the quality of location information about underground infrastructure. If a formula could be found for sharing liabilities between government, excavators, and network operators, it would motivate all players to implement procedures to remove the risks associated with underground infrastructure during construction. In countries such as the U.K. and U.S., the bury and find approach provides little motivation for network operators to improve the quality of their information about the location of their network assets. Some jurisdictions are implementing policies for shared liabilities to motivate all stakeholders to become involved in capturing and sharing better data about underground infrastructure to reduce risk.
The role of surveyors
Accurately mapping underground utility and telecom network assets represents a growing opportunity for professional surveyors. In order to ensure continuing improvement in the accuracy of location information about underground utilities, some international jurisdictions are requiring that new or modified underground infrastructure be surveyed by a registered surveyor.
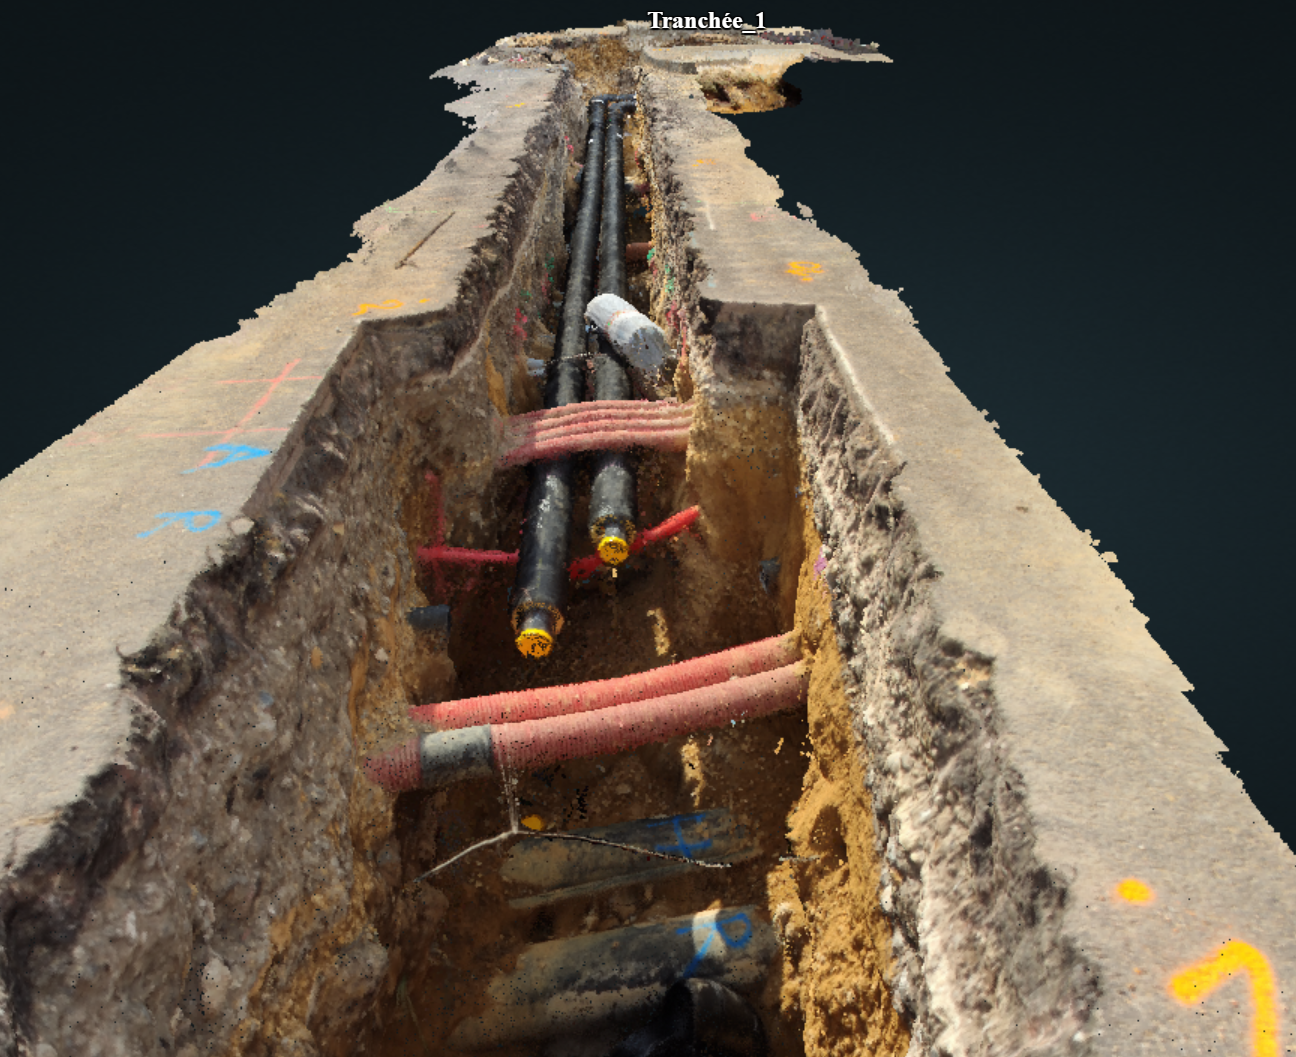
A 3D model of underground utilities captured with a smartphone. Courtesy AVUS.
Technical advances are making it easier to conduct underground surveys. Owners, engineers, and contractors are increasingly recognizing that surveyors who can offer both above- and below-ground surveys are able to add significantly more value than the traditional above-ground-only survey.
Reduce damage; manage information
While SUE surveys have been shown to reduce the risk of budget overruns and project delays, they are not a silver bullet for reducing the number of incidents of underground utility damage.
Two jurisdictions where historical statistics reveal a reduction in annual incidents are Japan and Heathrow International Airport. For example, service strikes (accidentally hitting a utility cable or pipe) due to inaccurate information about underground infrastructure have declined at Heathrow by a factor of six since 2002 while total construction activity increased significantly. In both Japan and Heathrow a comprehensive multi-faceted approach was adopted that included policies, regulation, changes to construction practices, and new technologies. (These are described in detail in the white paper.)
In the last few years several jurisdictions recognizing the importance of complete, accurate and up-to-date location data about underground infrastructure have initiated innovative programs related to data about the underground. In 2019, legislation in Colorado mandated a subsurface utility engineering (SUE) survey prior to engineering design for public civil construction projects to reduce unnecessary and expensive relocations of utilities.
It also required that network operators improve the quality of the information they maintain on the location of their underground infrastructure and provided civil penalties for submitting inaccurate as-builts. Also groundbreaking is Colorado’s legislation and regulation that mandates mapping natural gas gathering and flow lines and making this information open to the public via a web portal.
In 2017, the Singapore Land Authority (SLA), Singapore-ETH Centre, and the Geomatics Department of the City of Zürich started the Digital Underground project, a comprehensive program of technologies, policies, and processes for achieving and maintaining an accurate, current, and complete map of subsurface utilities in Singapore.
In the U.K. one of the first projects of the recently created Geospatial Commission is an initiative leading to the creation of a National Underground Assets Register (NUAR) for sharing location information about underground utilities among network operators and government. Two pilots in northeast and in central London have been completed. The project is moving forward with plans to mandate sharing of location information about underground infrastructure at the national level.
In 2015, the Netherlands mandated a national system for sharing underground geotechnical information exposed through boreholes and other digging techniques. On January 1, 2018, it became mandatory to report the first three data types, geotechnical surveys (CPT), groundwater monitoring wells and soil drilling sample profiles. In June 2018, this data became publicly available via the Dutch open data portal PDOK. Work is underway to implement data models for the remaining 23 data types.
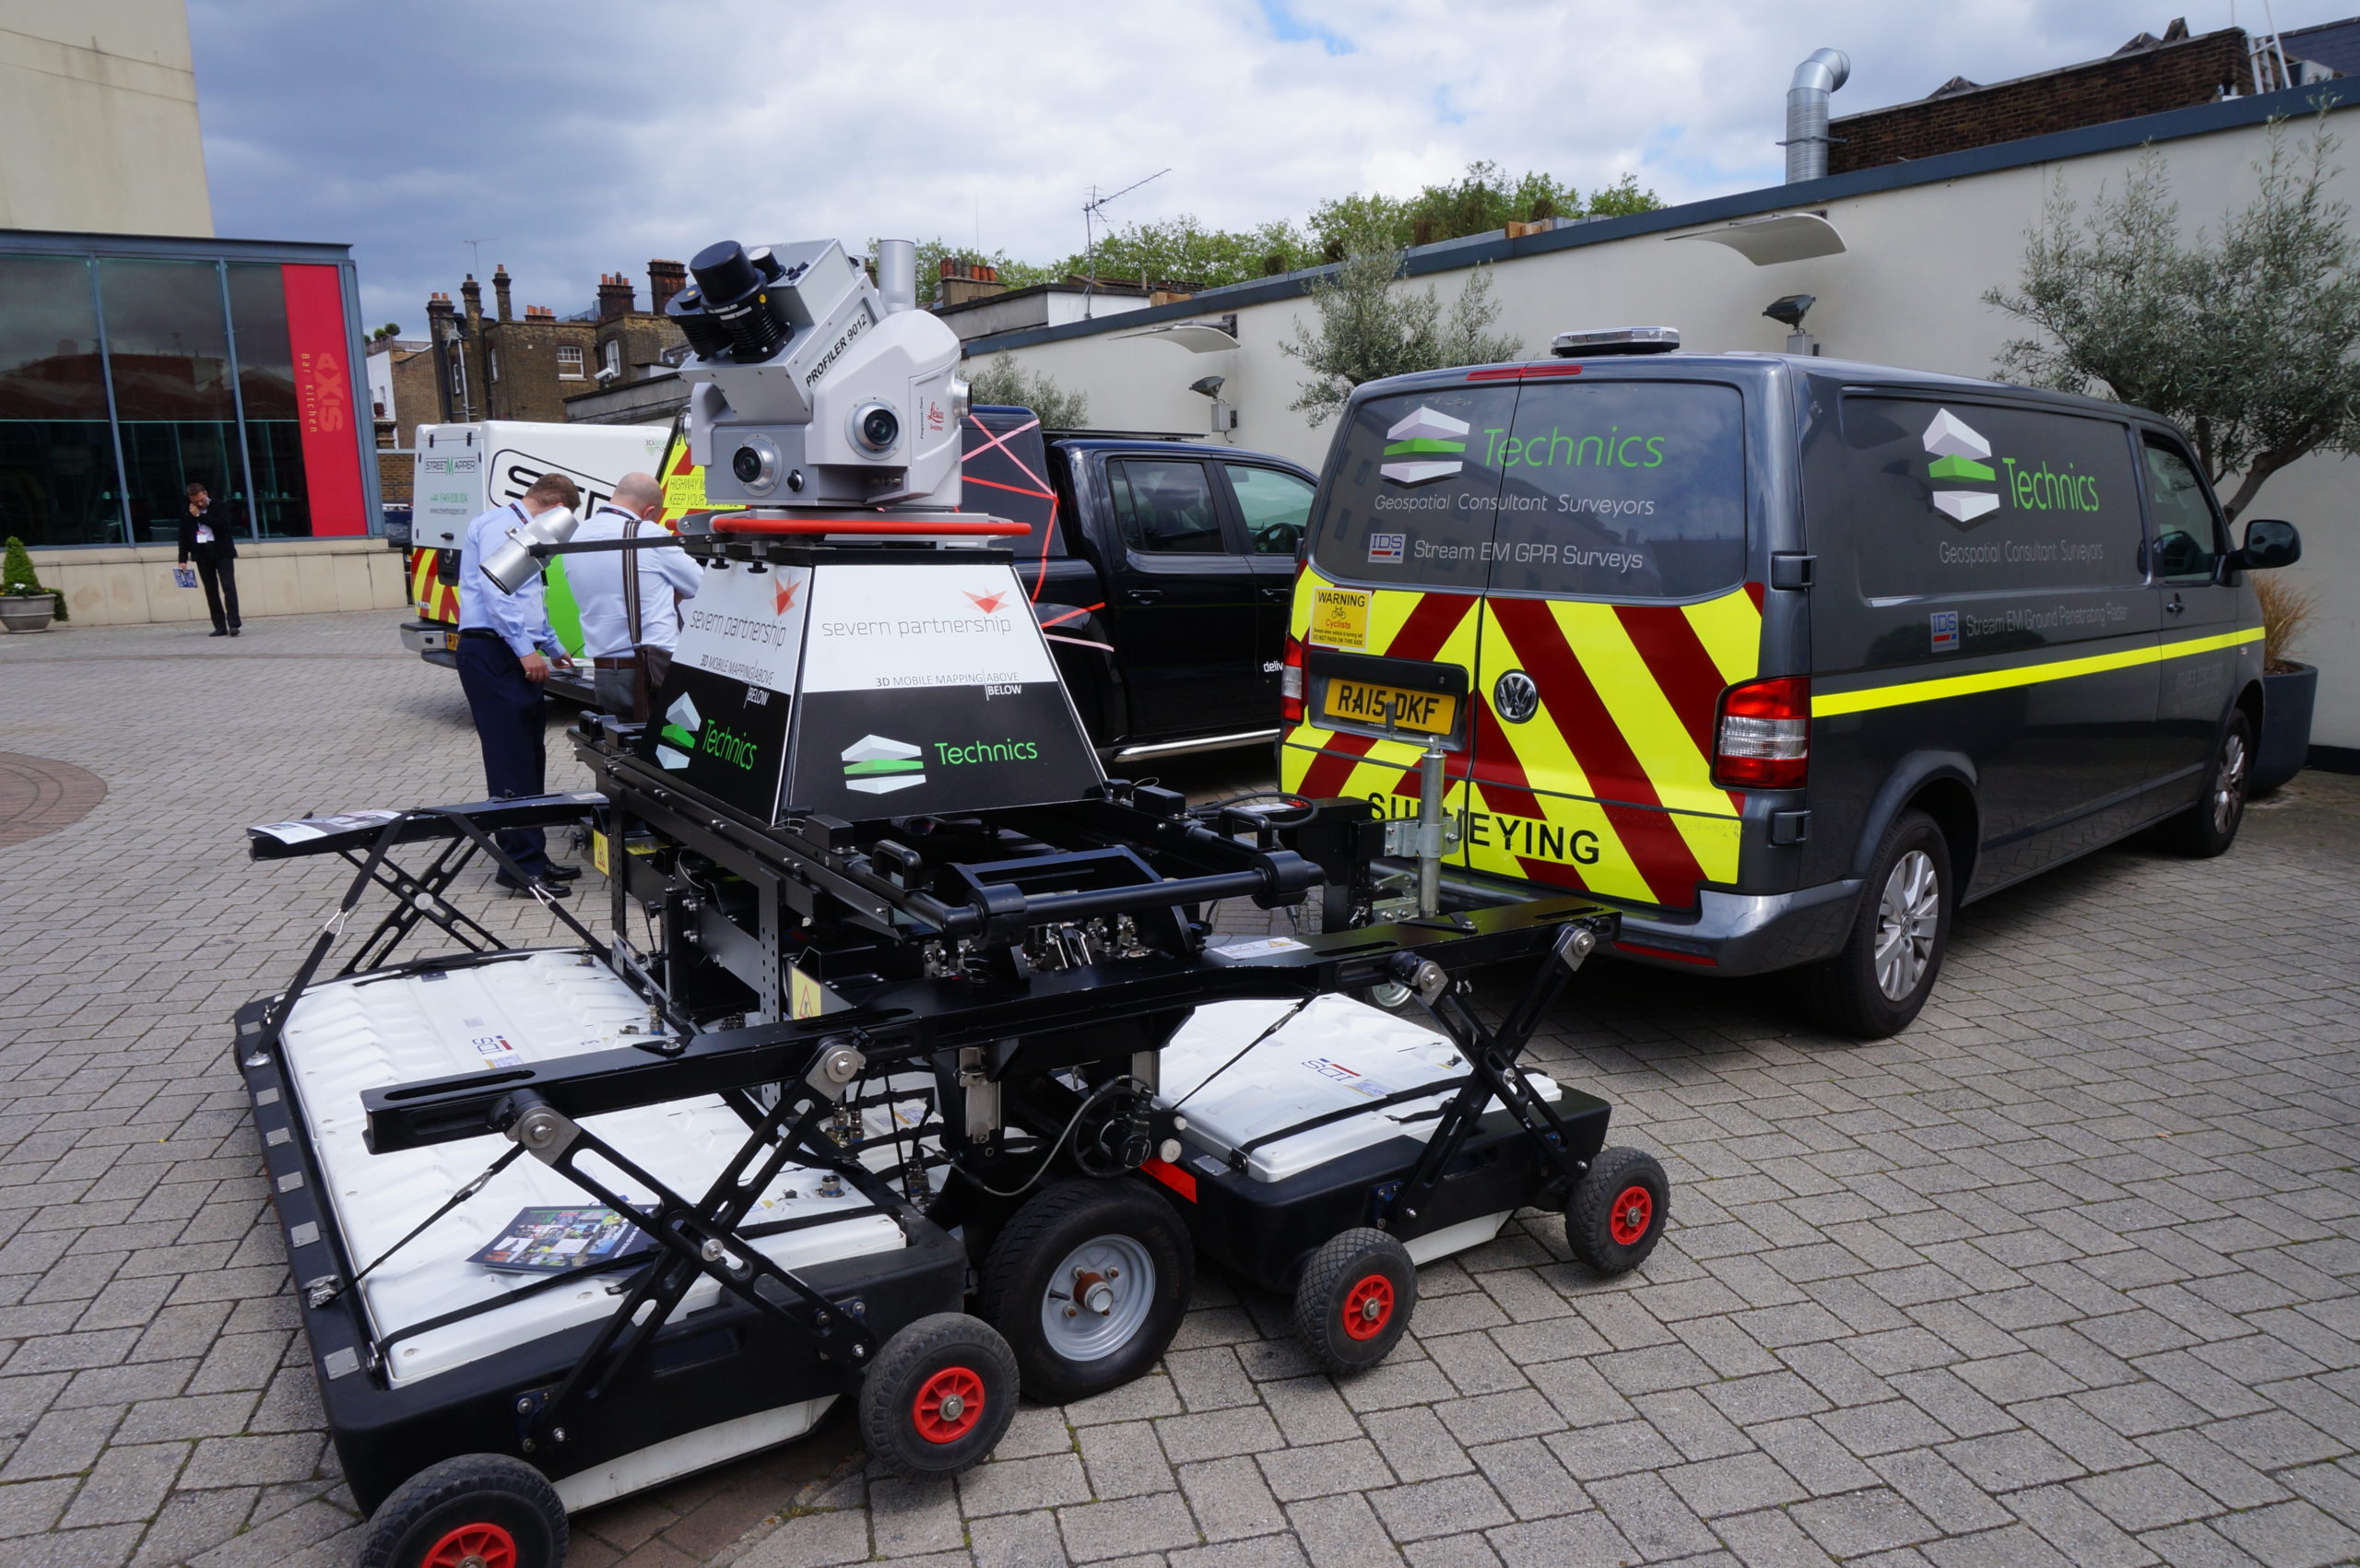
Combined LIDAR and ground penetrating radar array for simultaneously capturing above and below ground imagery.
Recommendations
Based on a review of many international initiatives to develop programs for underground infrastructure information, a set of 25 recommended elements has been compiled that organizations and jurisdictions, including national, state/provincial and municipal, are using to address the challenge of damage to underground infrastructure. These can be grouped into broad categories.
- Reliable statistics on underground utility damage.
- Takingadvantage of the latest technical advances in underground utility detection and mapping.
- Policies, procedures, and technologies for raising the level of accuracy, timeliness and completeness of information, and developing and maintaining a 3D model of underground infrastructure.
- More sustainable design for underground infrastructure; avoiding sharp bends in pipes and ducts and including technologies for making utilities easier to track.
- High degree of collaboration between network operators, consulting engineers, contractors and project owners.
- Digitalizing the capture, sharing and updating of location information about underground infrastructure, including either a single physical database maintained through ETL processes or a federated database combining multiple physical databases each curated by a network operator. A single map of all underground infrastructure, including utilities, telecom and unknown and abandoned equipment, is provided via a browser or handheld device.
- Data protection of location information about underground networks, including security, privacy and protection for competitive information.
- Providing access by stakeholders to underground infrastructure location information throughout the construction project life-cycle beginning with a SUE survey prior to engineering design which is accessible by planners, engineers/designers, construction contractors and those responsible for operations and maintenance.
- Liability model for sharing responsibility for costs associated with underground utility damage.
- Training and education ensuring that those involved in the detection, locating, and mapping of underground infrastructure are trained in the appropriate technologies and techniques to ensure completeness, accuracy and currency in the data they collect and manage.
- Aviable business model to maintain adequate funding for the program.
The Japanese and Heathrow experiences have shown that to successfully reduce utility damage requires a comprehensive approach that implements most, but not necessarily all, of these recommendations. A successful program for reducing underground utility damage requires the involvement of many stakeholders, including network owners and operators, planners, surveyors, SUE engineers, design engineers, construction contractors, regulators and government agencies such as MOTs/DOTs.
The goal is to reduce the risk of utility damage over the lifecycle of infrastructure from planning through operations and maintenance. A successful program reduces damage, costs, injuries and fatalities, and results in more projects on-time and on-budget. It also significantly reduces the cost of infrastructure construction and maintenance.
Additionally, there are significant benefits for the construction industry. For example, reducing risk reduces insurance costs for an industry where margins are very low. Furthermore, developing and maintaining an accurate 3D map of underground infrastructure has potential benefits beyond construction such as utility outage management, disaster planning, emergency response, urban digital twins and smart cities.