How reliable are optical monitoring techniques for civil engineering structures?
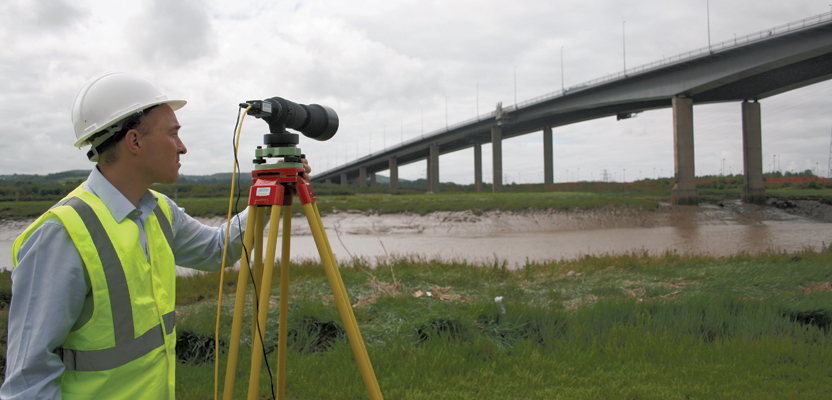
Editor’s Note: Camera-based systems have long been used in industrial metrology for manufacturing, materials testing, and integrity monitoring. Now they’re finding utility in the “macro” realms of AEC (architecture, engineering, and construction). Many people in the AEC disciplines might view robotic total stations or scanners as the practical top end for precision and may have only just begun exploring close-range terrestrial photogrammetry (CRTP), but camera-based tools can perform at sub-millimeter precisions and can easily be used for civil/structural purposes. The following article is an adaptation of a formal benchmarking trial of various monitoring techniques from Imetrum (a prominent industrial and structural testing and metrology firm) and the National Physical Laboratory in the UK.Cameras are increasingly being used as an innovative tool for monitoring structures. Combined with the right analysis tools, they have the potential to save time and money over conventional networks of distributed sensors, as well as to enhance the quality of data available to engineers.
Researchers at the National Physical Laboratory and universities worldwide are applying camera-based measurement systems with considerable success at present. Imetrum has refined the algorithms used by these systems to increase speed and resolution, to produce a system incorporating its Video Gauge software that has real potential for structural monitoring.ameras are increasingly being used as an innovative tool for monitoring structures. Combined with the right analysis tools, they have the potential to save time and money over conventional networks of distributed sensors, as well as to enhance the quality of data available to engineers.
The benchmarking trial described here was devised to test the accuracy and reliability of the system across a range of environments encountered when monitoring engineering structures. A third-party assessment such as this is essential before the technique can be offered to the wider civil engineering community.
Types of Monitoring and Benchmarking
The project starting point was to identify the broad range of all currently available monitoring technologies and look at the type of measurement they produce in terms of availability, resolution, measurement frequency, measurement quality, cost, and ruggedness. This was done with the help of a literature survey and exploiting the trial participants’ own expertise.
We then developed six application notes to simulate technology selection for real projects. Each application note examines a particular type of monitoring project (for example, a dynamic load test of a railway bridge or the long-term monitoring of a dam) and proposes the techniques most likely to be of use for monitoring.
The second and third stages of the project benchmarked these optical techniques against conventional sensors and investigated their performance in different weather conditions. The benchmarking findings set out how Imetrum’s system performed in these diverse environments.
Trials were carried out on four separate bridges, and the data collected was compared with that gathered by potentiometers, a laser tracker, accelerometers, and other camera-based systems. Steel, concrete, and composite bridges were monitored. The bridges were chosen for a combination of interest, relevance, and ease of access.
Displacements within 0.1mm
Across this range of structures and measurement devices, the displacements recorded were within 0.1mm of each other, for both the short-term and long-term trials, except the robotic total station comparison, which in itself is the least accurate of the techniques compared. These results are across a range of different materials with different patterns. Sample results for each trial are shown here and in more detail on xyHt’s website.
Potentiometer comparison
Figure 1 shows bridge displacement at a single point during passage of a high-speed train. The Imetrum system was placed approximately eight meters away; it used the pattern created by the rivets on the underside of the main steel support beams as a virtual target. The potentiometer was mounted on a hydraulically jacked pole so that it was just touching the underside of the bridge. The passage of individual train cars and the relative magnitudes of the axle loads applied by those cars are easily identifiable. Maximum difference between the values reported by the two measurement systems is 0.1mm.
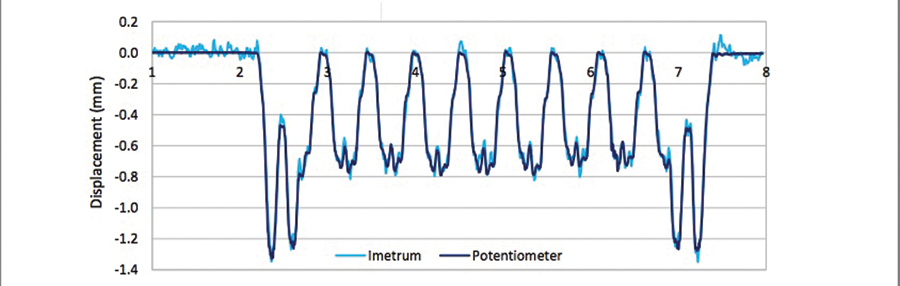
Figure 1: This plot compares displacements from high-speed train crossings of a bridge. The Imetrum camera-based system results are compared to conventional potentiometer readings.
Accelerometer comparison
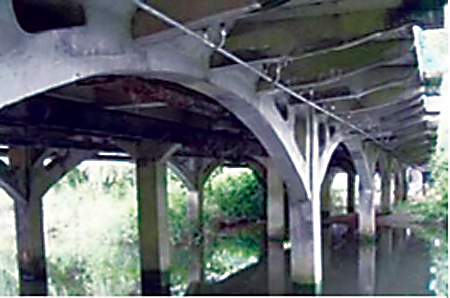
Tuckton Bridge, a subject structure in the benchmarking trial, is one of the UK’s oldest reinforced concrete bridges.
The plot in Figure 2 shows accelerometer data and displacement measured with Imetrum’s system. The two traces show clearly the effect of both axles of a local bus hitting a sunken manhole, with the magnitudes and noise levels telling a similar story despite measuring different parameters.
It is also possible to extract frequency data from both traces, which in this instance gives a natural frequency of around 12Hz. For the monitoring of Tuckton Bridge, the camera was approximately 20 meters away from the points of interest, on the shoreline.
The lens was focused on one of the cantilever beams and used the natural staining and texture of the concrete as a virtual target. There were no noticeable effects on the data caused by vibration transmitted from the bridge.
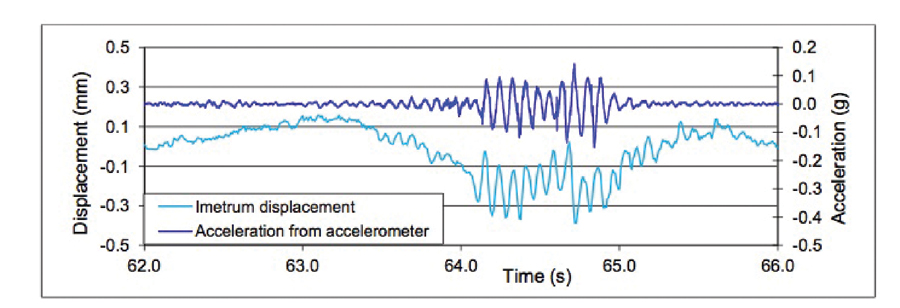
Figure 2: Impact response of Tuckton Bridge to a local bus hitting a sunken manhole (lid and casing).
Laser tracker comparison
Data from this test, seen in Figure 3, were taken at night with localized lighting around the measurement areas. The Imetrum system was around ten meters away from the structure and used the natural patterning on the concrete face as a virtual target. The laser scanner trace has been offset by 1mm in the graph in order to show the two traces. Note the similar noise levels of the two systems and their ability to detect the vibration induced by trucks as they stop on the structure and then again when they drive off.
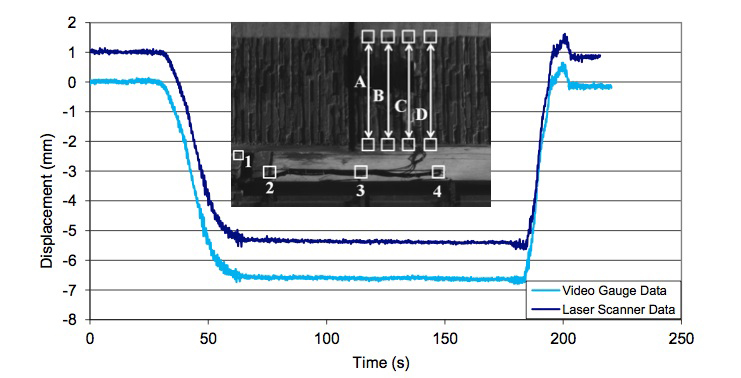
Figure 3: Typical vertical displacement trace with inset image of target locations from software.
Robotic total station comparison
In Figure 4, vertical displacement of a footbridge was measured using the Imetrum system, a robotic total station, and a pole-mounted linear variable displacement transducer. The robotic total station and the Video Gauge both took measurements four times per hour, with the trial lasting one month. Infrared lighting was used to continue taking measurements 24/7.
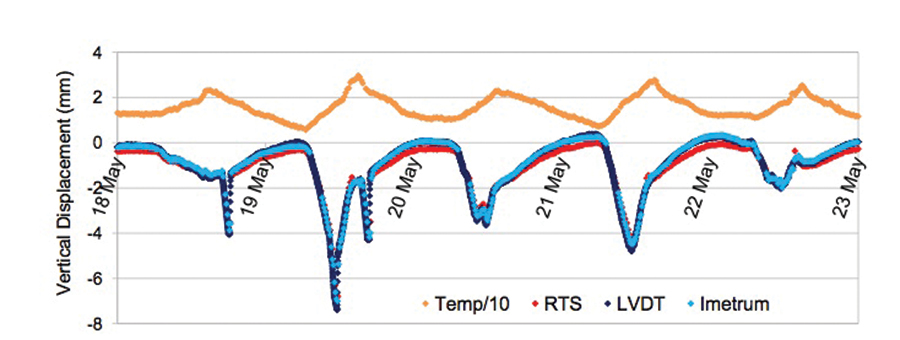
Figure 4: Vertical displacement over a week: compared are measurements from the Imetrum system, a robotic total station, and a linear variable displacement transducer.
The natural pattern and structure of the concrete surface was used for measurements. There was occasional loss of data when the bridge face was saturated with rainwater, so the pattern changed. The changing lighting conditions meant that the number of locations where the Imetrum system could effectively take measurements was much lower than in the short-term trials, although measurements were possible in some locations throughout the period.
Work done since has indicated that adding targets to a structure improves this situation considerably. In most cases, if a target is fitted then that position can be tracked. The trial also confirmed the importance of ensuring a stable mounting or a means to compensate for any camera movement. A simple way of correcting for any movement is using reference points when they are visible within the image.
Comparison of other camera techniques
Digital image correlation (DIC) uses variation in consecutive images to determine movement of everything within view. It is a static monitoring technique, which produces images such as Figure 5 showing strains or displacements across a whole structure. It is therefore not possible to do a direct comparison plot with Imetrum measurements. These figures, however, show that the peak displacement (under an axle) as the yeoman hopper crosses the bridge is approaching 3mm, which is similar to the value recorded on the trace from the Imetrum system and the potentiometer.

Figure 5: Bridge deflection during passage of a loaded freight train.
Testing in Different Environments
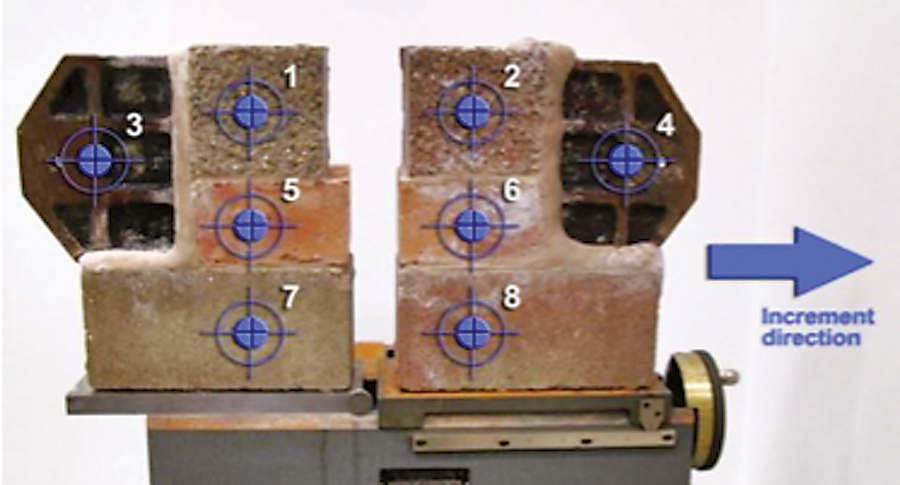
One of the National Physics Laboratory’s test rigs showing measurement (target) locations.
There are potential concerns around environmental conditions when using a camera-based system. These include:
- What obstructions impact the line of sight (snow, rain, fog etc.)?
- How does changing weather impact the appearance of a structure (and from there, the accuracy of measurements taken)?
- Will the hardware and software endure an exposed operating environment?
- What is the impact of heat haze?
To test exhaustively for all possibilities of these scenarios is not practical. However, the trial set out to look for indications of the effects of each scenario. Tests were performed outdoors, using a rig with materials mounted on it.
Measurements were taken at 15 Hz for 60 seconds, then the rig was moved a set distance prior to another 60 seconds of data being recorded. This was done at three different distances, but with a similar field of view in each case. The effects of sun and rain were investigated (experience has shown that dry, overcast conditions are ideal for the system). The line of sight of the camera passed over a tarmac surface, which is known to be a cause of noise because of the heat haze generated. A summary of results is seen in Figure 6.
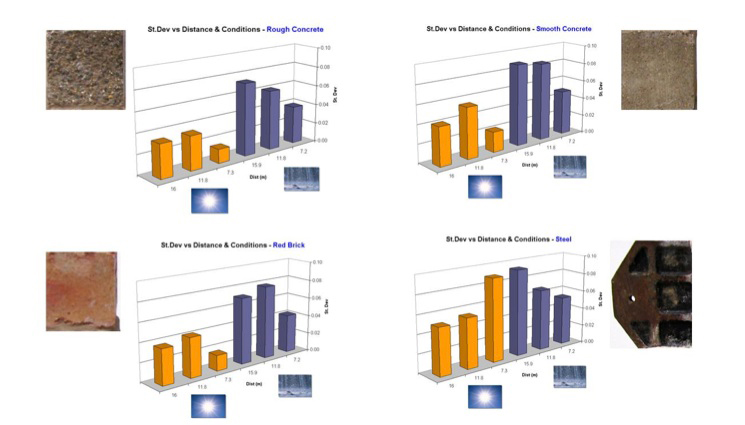
Figure 6: Standard deviations of displacement measurements
Rain approximately doubles the amount of noise on the system, and proximity to the structure also has an impact. However, neither factor impacts the mean measurement value recorded. The distance effect is the result of “optical noise” (such as heat haze).
The results also indicate that at the scale of this test, rough concrete gives the cleanest data. This is as expected given the patterns present on each material surface. Results would differ at a different scale; for example, the pattern of mortar joints between brickwork provides a good virtual target for the Video Gauge.
The tests also showed that care needs to be taken to ensure that differential thermal expansion is not allowed to happen when direct displacement measurements are required. Leaving the system on a metal tripod in the sun for 15 minutes caused a drift in readings of 1mm. The effect of differential measurements over this same period was an order of magnitude less, confirming the anticipated mechanism of camera rotation leading to an angular change (and therefore apparent displacement).
A separate trial (undertaken in addition to this joint industrial project) has been conducted to assess degradation in image quality over a longer period. The images in Figure 7 were taken six months apart by a camera that has been permanently installed less than two meters from live trains on a rail bridge. While there have been notable changes to the bridge itself, the image quality remains excellent, and there have been no noticeable changes to the quality of measurements.
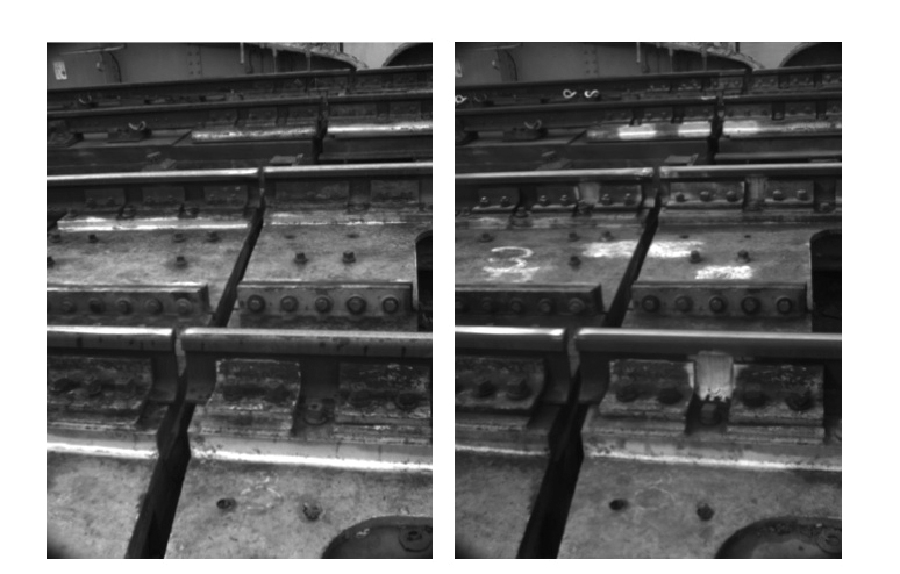
Figure 7
Conclusions
Imetrum has developed a system that is flexible, reliable, and robust across a wide range of application environments and measurement requirements. When measuring in the short term, it is possible to produce good-quality measurements without the need to access a structure, including placing targets on it.
The system has been tested at up to 117Hz in the field during the day and night and has proved reliable. Consideration needs to be given to the location and orientation of the system to mitigate against the impact of heat haze and differential expansion of the mounting.
Accuracy is within 0.1mm or better of the sensors that have been benchmarked. Rain approximately doubles the noise of the system but does not affect mean measurement values. For a good setup, the quoted resolution of 1/100th pixel is achievable. Hardware has been shown to be robust over a six-month installation.
Targetless monitoring for long-term installations is possible in a number of cases, but where there is changing lighting, targets need to be fitted to a structure to guarantee a successful monitoring installation at the desired locations.
This document has been adapted from National Physical Laboratory report MAT 49 (2011), A review of techniques suitable for measuring position or strain in Civil Engineering structures, Nick McCormick, Grant Klimaytys, Jerry Lord.
The work was done as part of a UK Government National Measurement Office-funded Joint Industrial Project. The support of Network Rail, Bournemouth County Council, Carillion WSP and Amey is gratefully acknowledged.