Geospatial information has long played an essential role in the energy industry, but now a new technology is cutting costs while improving the flow of knowledge.
Editor’s note: The energy sector, oil and gas in particular, has grown more rapidly in the past half dozen years than in the past half a century. New fields, sites, and facilities have been popping up sometimes faster than supporting infrastructure (such as pipelines and rail). Set against the backdrop of this boom is the adoption of close-range photogrammetry, which captures observations in an instant and then enables multiple stakeholders to extract precise 3D measurements and details. How have such solutions served this dynamic sector? xyHt has been asking professionals in the oil and gas sector about their adoption of newer technologies, but often they report that they’re too busy to take the time to tell their stories. So we’re happy to present the following case study.If you ask Jason Jung about his job, you’ll receive two answers.
His long answer is that he’s the manager of 3D laser scanning for CH2M HILL, where he’s worked for nearly 10 years providing industrial surveying for clients in the energy and petrochemical sectors. In a career spanning more than two decades, Jung worked in land and engineering surveying before focusing on the environmental and industrial areas. His company’s list of clients reads like a Who’s Who of the world’s largest companies in the oil and gas, energy, chemical, pharmaceutical, and manufacturing industries.
Jung’s second answer to the question is brilliantly short and descriptive: “We quantify and eliminate geospatial unknowns by telling people what they have and where it is.” As part of his work to accomplish this innocent-sounding task, Jung is leading the charge in applying geospatial technologies to some of today’s most demanding applications.
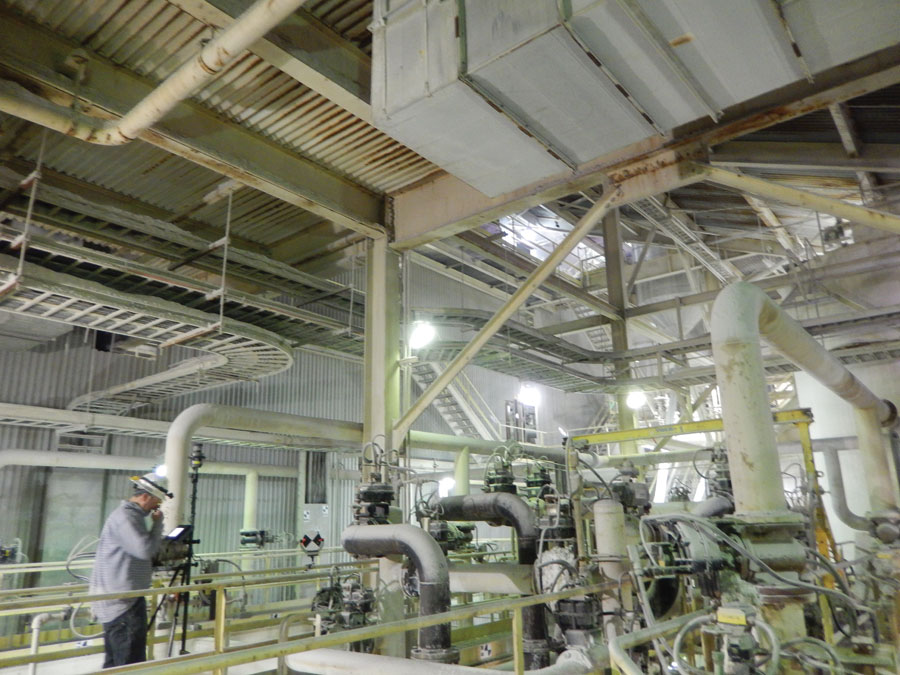
A technician captures a panoramic image in a complex facility. The images can be combined with data from scanners, GNSS, and total stations. Simple viewing tools make the information available to project teams and clients.
Industrial Geomatics
Jung’s team of surveyors and contractors gathers data that becomes part of a dense flow of information that CH2M HILL uses for engineering design, analysis, procurement, construction, and project management. Going beyond the traditional spatial information of position and description, the team’s data helps develop answers to the deeper questions of the status and condition of facilities and equipment, how to maintain and repair them, and how to do so safely.
Jung describes their work as “industrial geomatics,” which serves as the platform to gather and manage information on complex sites and facilities. “We’re morphing into the more mechanical, industrial sort of 3D geodatabase design,” he said. “There’s a huge value in that information. The data that we provide is at least as valuable in the operations and maintenance aspect as it is for engineering design. Scanning and surveying a facility for both engineering and operations delivers a twofold yield. If managed correctly, it’s very effective.”
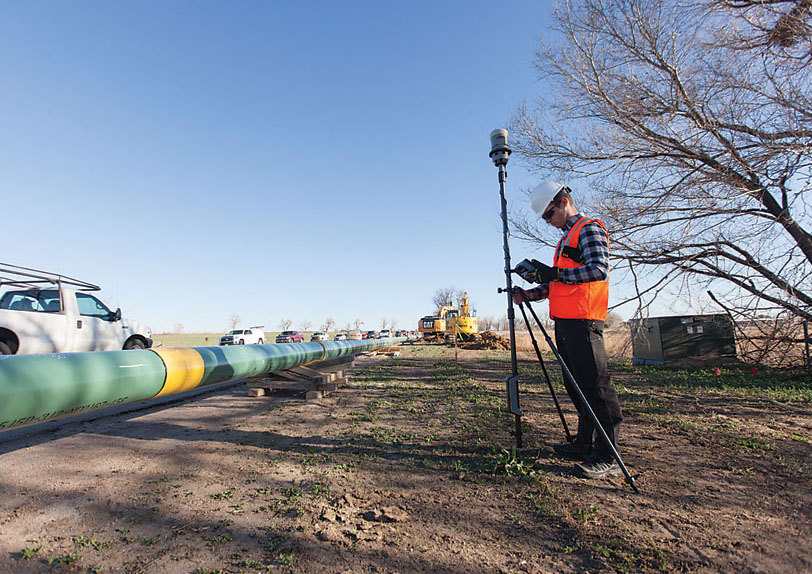
Using an imaging rover combined with GNSS, a surveyor captures location and panoramic images in seconds, including information written on the pipe to document welding and construction activities.
Jung’s industrial geomatics help various disciplines at CH2M Hill see things from their clients’ perspective. For many clients (Jung’s data goes to in-house and external recipients) the method for collecting information is unimportant. By the time a project manager sees the survey results, the data has been boiled down to information needed for design and analysis. It’s common for multiple specialties such as environmental, revegetation, or planning to work off a single data set, extracting similar information for different purposes. By leveraging the ability to have a multi-disciplinary project team work from one database, CH2M HILL can introduce efficiency and cost savings across the board.
In addition to gains in efficiency, safety has emerged as a key benefit of accurate spatial information. Knowing the what and where of everything in a facility supports good planning on operations and maintenance activities. “Many industrial accidents occur because proper procedures aren’t followed or aren’t readily available,” Jung said. “With everything based on a spatial database that can be easily accessed and read, a lot of these incidents might not happen.”
Engineers and on-site teams can use the up-to-date information to design and execute operations, maintenance, and upgrades. Plant repairs and retrofits can be planned to exacting detail. Engineers can verify that new machinery fits into a designated space and design connections to existing equipment. The spatial data also helps planners determine the best way to move large items through a facility without moving or damaging equipment already in place.
Jung said that CH2M HILL has used 3D laser scanning for years as a source for geospatial data, and it remains the tool of choice for much of his work. The combination of point cloud data and sophisticated 3D modeling software provides good results in industrial settings. Recently, however, he discovered a new approach to collect and manage data on large, complex projects, an approach that leverages imaging rovers, GNSS and optical positioning, and advanced software.
Adding Value: Positions from Pictures
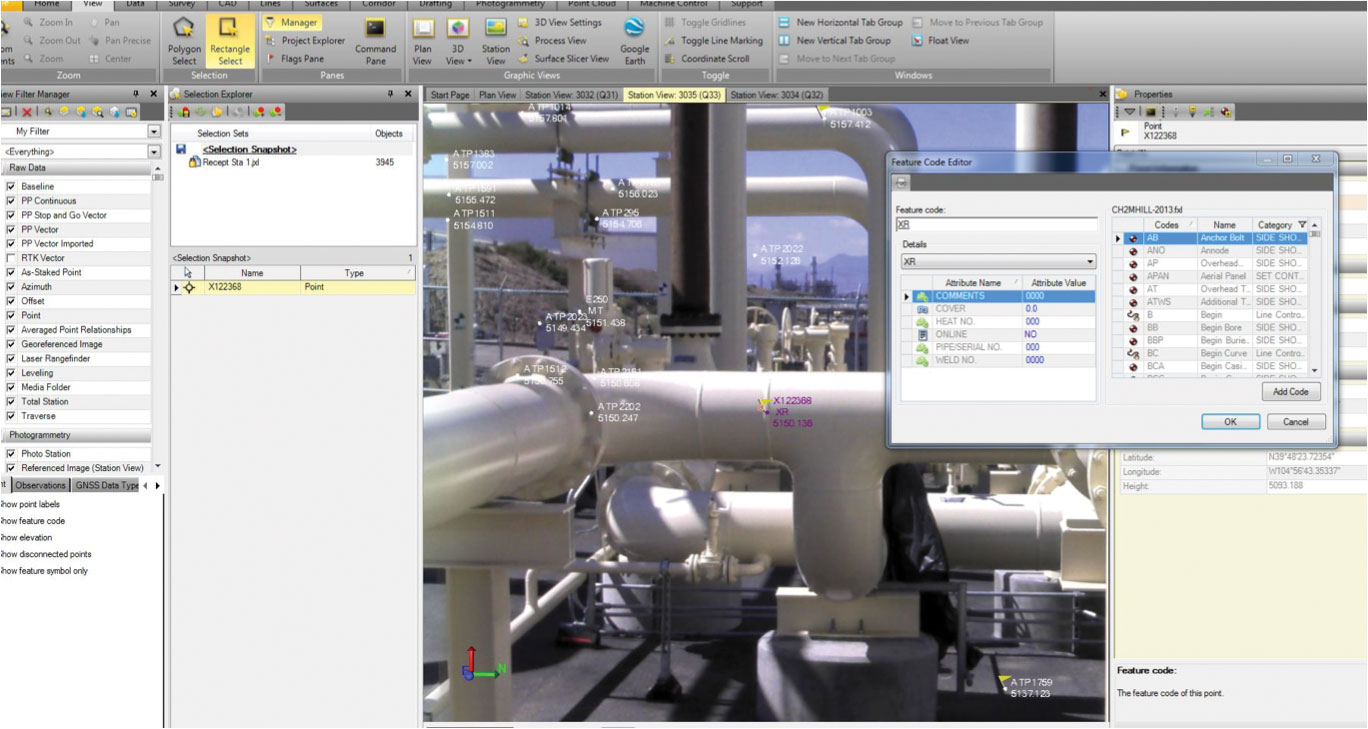
Office software uses multiple panoramic images and photogrammetry to compute and store individual points. Points can be created without the need for field personnel to work in difficult or hazardous areas.
Early in 2014 Jung began working with a Trimble V10 imaging rover. Mounted on a survey rod, the rover contains an array of high-resolution calibrated cameras that capture a 360-degree panoramic image in a single operation. When integrated with a GNSS receiver or prism target for a total station, the imaging rover automatically produces georeferenced panoramas. The system is controlled using a handheld controller or tablet and captures images and position in the same time that it completes a conventional survey measurement.
With his objective of providing useful information to multiple disciplines, Jung quickly recognized the value of the photographic data: it enables everyone on a project to see exactly the same thing and know from where they are seeing it.
“The ability to give an entire project team a georeferenced 360-degree view is an incredible tool,” Jung said. “It’s important not just for engineers but for other disciplines inside the project as well. We do a lot of long-line pipelines where we work with archeologists, planners, engineers, and biologists. To have photographs that you can easily reference and attach to a Web map or a GIS database provides a really important tool.”
On large projects, construction managers and client site management often collect a variety of information and photographs, which may be squirreled away in different locations and forms. While a plethora of information may exist, it is not always easily shared nor accurately referenced. The V10 allows an array of stakeholders including right-of-way, land acquisition, and environmental groups to work off the same data set. “It puts everybody on the same page,” Jung said. “On a large-scale project that used to be almost impossible.”
The imaging rover can be used as a stand-alone solution or as an enhancement to point cloud or traditional survey data. When working on facility scanning projects such as refineries and petrochemical facilities, CH2M HILL crews can use it to supplement scanning data. They place the V10 into confined or obstructed areas to capture details not visible from the scanner, tying the images into the point cloud without needing additional targets. In addition to saving the time needed for an additional scan setup, the approach provides images that office software can drape over point clouds to produce photorealistic 3D models.
The panoramic images also streamline processing by providing more information for office technicians, Jung explained. “I typically get six to ten phone calls per week from the modelers—just the usual back and forth questions. Even with the best scan data set you still have some questions. But since we started rolling out this V10 supplemental [data], it’s cut the questions down to two a week instead of ten. It’s greatly helped.”
Taking to the Field
Planning and construction of an oil or natural gas pipeline requires geospatial information over large areas. CH2M HILL crews use the imaging rover to support the three phases of pipeline construction: preliminary surveys and planning, construction staking, and as-builts. The need for spatial data can be sparse as for general topography. In other areas, it may require sufficient density to design a road crossing or avoid existing features.
The surveyors use the imaging rover during the planning phases to supplement conventional topographic and location surveys. In areas where dense data is needed, it captures a high level of detail in seconds. The crews use it to take photos in areas where conditions might require the pipeline to avoid utilities or other structures. The panoramic images allow designers to see the site and develop alternative plans without sending crews back to measure additional points.
Jung said it’s like having a backup plan already in his pocket. “There’s a lot of micro-routing that goes on when you’re dodging utilities, as when you need to avoid a manhole that’s a few feet away. To have the option to see all these items in a photograph and make decisions in a conference room with all the individual disciplines present is a great benefit.”
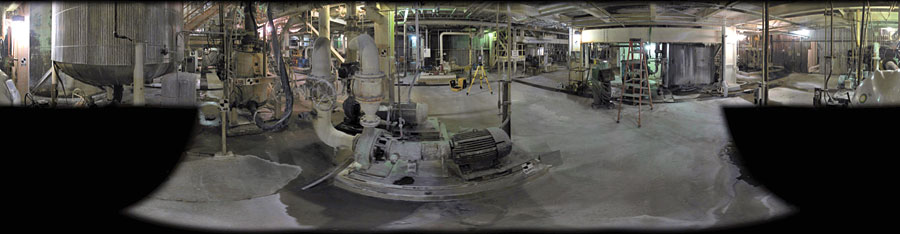
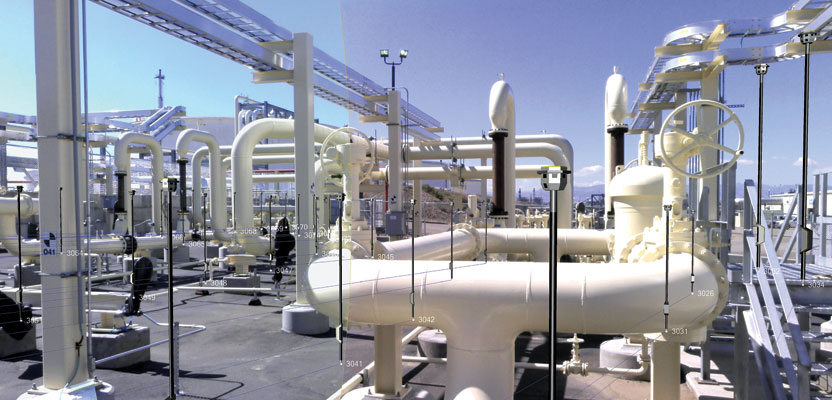
A panoramic image provides a 360-degree view of an industrial facility. The total station (top, right) provides precise positioning for the imaging rover. Photo targets attached to columns and equipment aid in image processing and photogrammetry.
For the construction phase, the surveyors use GNSS and total stations for stakeout. Once the layout is complete, it’s common for crews to provide coordinate lists or cut sheets to document their work. The imaging rover takes things a step further by providing a visual record of the stakeout work. While the printed lists might be edited or challenged, the panoramic photos provide evidence of the points set and overall site conditions. In the event that the surveyors’ work is questioned, they can use the photos to show the points and even tie them to other stakes in the area to confirm the as-staked positions.
As pipeline construction proceeds, it’s critical for crews to gather as-built data while the pipe is exposed. The data must be complete and fully reliable. Once the pipeline is buried, it’s difficult and expensive for the contractors to do dig-ups to resolve any problems or questions. Obtaining as-built data on an exposed pipeline can be challenging due to the need for speed; it’s not unusual to have heavy equipment standing by while survey crews complete their work. “Before backfill, you need to make sure you have all of your information,” Jung said. “Having a supplemental data set isn’t going to hurt, either.”
To conduct as-built surveys for inspection and documentation, Jung’s field equipment includes a Trimble V10 imaging rover with a Trimble R10 GNSS receiver, controlled using a Trimble Tablet rugged PC running Trimble Access software. Much of the work consists of top-of-pipe measurements to locate the pipeline and its features. Pipe sections are welded together, and a survey team captures the location of each weld.
The location data is combined with quality control information (photographs, x-rays, serial numbers, and more) required under federal regulations. They use GNSS and the imaging rover to capture locations and panoramic images in a single step. Then, they detach the tablet from the survey pole and use it to take detailed snapshots of individual welds and features.
“You have the position together with the photograph of the position,” Jung explained. “In addition, you have another georeferenced photograph of information that’s inked onto a sticker on the pipe that provides all kinds of additional information. It backs up the data you have in your attribute library so you have a cross reference of information.” The positions, tablet photographs, and panoramic images from the imaging rover are processed into a spatial database for the pipeline, which provides a complete record of the excavation, welds, and pre-backfill conditions.
Points from Pictures
Even the best survey crew can miss a few things in the field. On long-line pipelines, crews can mobilize hundreds of miles down line. Keenly aware of the cost of multiple trips, CH2M HILL uses imagery to develop points and information in the office.
Using the photogrammetry tools in the software, office technicians can combine multiple panoramas to create 3D models, orthomosiacs, and individual points. If something is left behind or if right-of-way teams need data for an adjacent property, it’s likely that the additional information exists in the panoramic photos. The cost to extract additional information in the office is tiny when compared to the time and expense of returning to the site—even assuming that site conditions haven’t changed.
Jung said that pipeline planning includes a lot of channel and ditch work as well as drainage redesign. Instead of using GNSS or total stations, the V10 enables crews to capture data to develop topographic information on the affected site. “Say you’re in an area where it’s heavily wooded, and you’re running out of daylight, and you have maybe 40 shots left to go. You can pick this information up with a few properly placed V10 shots and then extract the information back in the office. It gives the project surveyors a level of comfort to have that safety net.”
While Jung’s focus is on industrial and energy projects, he sees the imaging rover as a powerful tool for other surveying applications. For American Land Title Association (ALTA) surveys, the panoramic images can make short work of collecting parking spaces, facades, access ways, and building dimensions. By collecting panoramic images instead of individual points with panoramic images, crews can conduct hours of field work in minutes.
The Double Time Machine
Georeferenced panoramas save time in two ways. First, imaging reduces the field time needed to capture 3D information on points and features and can eliminate the need for most return visits. “There are many instances where, with a couple of well-placed panos, you could pull your coordinates out and you save your budget or even your project,” Jung said. The V10 can be used as a stand-alone solution or as a supplement to point cloud or traditional survey data.
The second savings comes from the ability of images to freeze an instant in time. Beyond providing pre-backfill pipeline information, photos show the surrounding conditions on a site or plant facility. In addition to enabling additional measurements, the visual data allows teams to “travel back in time” to resolve questions or disputes and support quality control and environmental aspects.
The geospatial information produced by Jung and his colleagues provides the backbone for CH2M HILL’s complex projects in oil and gas and other industrial settings. The information must be correct and delivered in a way that enables large project teams to work off a single accurate, consistent data set.
“It doesn’t just feed the surveyor,” Jung concluded. “It provides the whole project team with information. The most important things for us are the photographs and getting everybody on the same page with a georeferenced position. You just can’t put a price tag on it. It’s going to change surveying, I think, more than anybody realizes.”