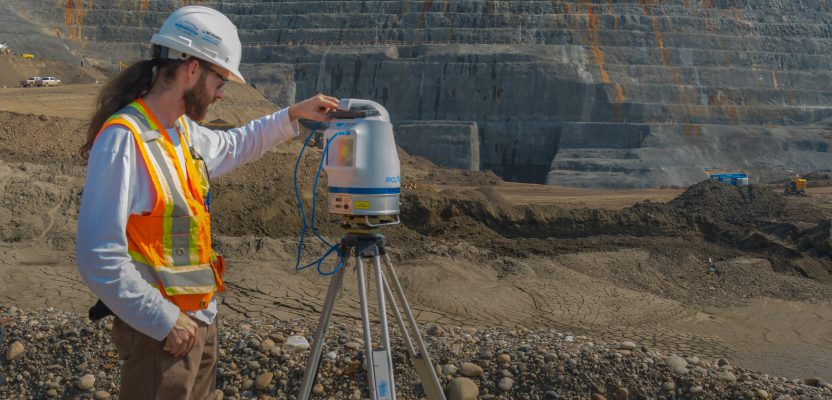
A team collects data with the Polaris terrestrial laser scanner at an engineered slope within the Site C construction area.
Laser scanning will be a critical tool for slope monitoring during nine years of construction for a hydro electric dam in a sensitive area of British Columbia.
Construction was started on the Site C hydro electric dam on the Peace River in north-east British Columbia in 2015. Once the dam comes online in 2024, it will provide an average capacity of 580 MW for the inhabitants and industries in the province. Complex Geotechnics
The land around Peace River is a sensitive area for the local and indigenous population. Furthermore, given the impact of the project, British Columbia’s power company, BC Hydro, needs to understand the natural geological processes occurring around the river and monitor how those processes are changing as the dam is constructed and its 83-km long reservoir filled.
The Peace River valley is geologically active because the last two glaciations deposited a variety of sediments, some with weak layers. The current river carves deep channels through these deposits, creating large slopes and cliffs that are prone to movement.
BC Hydro turned to BGC Engineering, an earth sciences and engineering consultancy, to make a full geotechnical assessment of the region, encompassing the natural terrain around the river and the proposed reservoir. The geotechnical assessment was used to estimate the expected erosion impacts around the reservoir shoreline and estimate potential impacts from landslides, flood events, and landslide-generated waves.
BGC’s work also includes topographic change detection analysis at the dam site, which involves a full-service solution, from field surveying to data processing to disseminating their results.
Survey Overview
Slope monitoring for the project includes many familiar survey tools such as monitoring with prisms and inclinometers, but tying the information from these traditional tools together are surveys using a terrestrial laser system.
Terrestrial laser systems are the natural choice for detecting subtle geological changes over such large areas; while prisms and inclinometers can accurately measure changes at a certain point, a single lidar survey can capture millions of points over an entire slope. This lets BGC detect centimeter-scale changes over large and continuous spaces and adds confidence to data being collected through other means.
BGC did not need to start from scratch, however. Before construction began, BC Hydro had the entire 750 km2 (290 mi2) site around the proposed reservoir surveyed twice using an airborne lidar system, once in 2006 and once in 2015. These datasets gave BGC a good idea of the area’s topography, and comparing the two datasets let them see where major slope movements had occurred in the intervening nine years.
BGC is using the initial assessment of potential impacts resulting from the reservoir filling, combined with the results of the analysis showing the most active slopes, to develop a shoreline-monitoring plan. To keep up to date, BGC surveys most of the regions twice yearly in the spring and fall, aiming for the short window where there are neither leaves on the trees nor snow on the ground to interfere with measurements. Some areas around the dam that are changing more rapidly get more frequent surveys, roughly every two months.
To execute the surveys, BGC has teamed with a rotating group of academics from the University of British Columbia.
Terrestrial lidar surveying began in 2016, and BGC initially cycled through several different scanner models. BGC has had experience with sensors from Teledyne Optech, so when the Optech Polaris was released in 2017, they acquired one of the earliest production units and started using it in their spring 2018 survey.
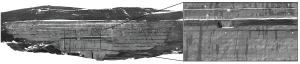
Sample data for the slope.
Survey Range
The sheer size of the project is daunting. During the preliminary planning for the reservoir-wide monitoring network, BGC had identified approximately 10 target areas with slopes that needed particular attention. These areas are spread out along the river and construction area, and many of them lack easy road access, which promised a tough survey regime moving from site to site on foot. The geometry of the slopes also requires multiple set-up locations to minimize the areas that are out of the scanner’s line of sight.
To minimize their work, BGC chose the Polaris-LR, which has the longest range of the Polaris models. This would let them survey slopes that have up to 300 m (984 ft) of relief and are nearly 1 km (.62 miles) wide. In addition, many target areas were on the river banks or in otherwise difficult-to-access places, so a long maximum range gave BGC the latitude to choose more convenient survey stations.
However, the advertised maximum range for a terrestrial laser scanner assumes the beam is hitting a bright target that reflects a large amount of the laser energy back to the receiver, such as lightly colored dry concrete. It also assumes that the beam hits a solid object and produces a single, easily detected return pulse. But heavy vegetation breaks up the beam to produce multiple weak returns, each of which has only a fraction of the power of what a single return would have.
Together, these effects reduce the useful range of terrestrial laser scanning, so BGC was interested to learn whether the Polaris could still achieve sufficient range in the less-than-ideal conditions at Site C, where the slopes consist of often-wet soil or dark rocks and may be covered by large patches of thick vegetation.
The long-range Polaris-LR was originally specified as having a 1600 m maximum range, although later testing showed that it exceeded 2000 m in good conditions. In this project, BGC has found that the Polaris retains much of its maximum range, receiving good data at ranges between 1000–1200 m.
Survey Speed
With just 27 survey stations to hit at 10 different locations, BGC decided to set an aggressive survey schedule. To help meet this schedule (and spare their backs), they decided to leave their 50-lb. Honda generator at home. Instead, they rely on the Polaris’ battery life to get them through, using two pairs of hot-swappable batteries for one 12-hour survey day.
They also speed up the process by skipping target georeferencing, since placing the targets would prove time-consuming, especially when the target areas are on the other side of the Peace River. Moreover, BGC has chosen the target areas specifically because they contain potentially unstable slopes, so it would be difficult to have a surveyor climb them just to place targets.
In lieu of that, BGC relies on the Polaris’s integrated GNSS receiver to roughly georeference the data, then aligns it more accurately back at the office by comparing it to the data from the old airborne lidar surveys and previous terrestrial lidar surveys.
With these efficiencies, BGC can cover multiple survey stations per day. Even in long-range mode, the Polaris still operates at a pulse repetition frequency of 50 kHz, five times faster than the older ILRIS-LR system. In its medium-range and short-range modes, they can operate the Polaris even faster, at 200 and 500 kHz respectively. In addition, the Polaris has a streamlined workflow that considerably reduces the time and hassle needed to get the system set up for each survey.
Ultimately, the Polaris only needs about 30-45 minutes to survey each station, for a total survey time of two to four hours at each location, including two to four stations per site plus set-up and take-down time. Adding in time for travel and photography, BGC can hit two slopes of interest per day, covering all 10 stations in four to five days.
Detail and Precision
After each semi-annual whirlwind survey, BGC takes the data back to their offices to measure the progression of the geological processes around the reservoir. After parsing the point cloud data (and its associated imagery) using Optech’s ATLAScan software, BGC loads it into PolyWorks to align it with the previous year’s surveys.
The primary items of interest are areas of loss (where the elevation of the surface of the slopes has been reduced) and deposition (where the material has increased). These areas can indicate rock falls, landslides, or construction activity.
Such changes can be quite subtle, however, so BGC needs the most detailed, precise data that they can get. To boost the level of detail, the operators set the scanner to fairly tight point spacing, with only 5-10 cm (2-4”) separating adjacent points. For the most critical areas around the dam site itself, they set the spacing to 3-4 cm (1.5”) and are currently experimenting with combining multiple scans for even finer point clouds.
The precision of the data is strongly tied to the scanning hardware itself. The Polaris’ combination of high density and precision allows BGC to reliably detect depositions and losses as small as 0.03 meters in the most optimal cases. With such sensitivity, BGC can detect and measure subtle processes, then put them together to get a much better picture of where and how the landscape is changing, both naturally and as a result of the construction of the dam.
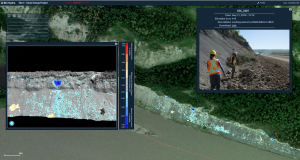
The web-based GIS interface is used to communicate the change-detection results.
Data Results and Ongoing Work
With such a plethora of data, it has actually become tricky to keep BC Hydro, the design team, and the construction contractor informed about the survey results around the project area. For a simpler project, BGC might use 2D shaded images of the slopes, but at Site C BGC needs to combine multiple sets of terrestrial lidar data, two sets of airborne lidar data, panoramic photographs, spot photographs, and instrumentation data, all of which is too complex to communicate effectively with 2D images.
On the other hand, while commercial GIS software could handle this multitude of data, BGC’s target audience is too large to give everyone a license, and it includes non-technical stakeholders who wouldn’t be able to make much sense of that software anyway.
Instead, BGC decided to analyze the data themselves and publish the results on a web-based GIS map. After logging in, their audience can visualize the TLS change detection results in several different ways, including 3D slope models and colorized point overlays. The GIS map can also bring up the supplementary data from the photographs, airborne lidar, and instrumentation.
Scalability is another reason why BGC went with the web portal. To see how the landscape changes as the dam is filled, BC Hydro wants the semi-annual terrestrial laser scanning surveys of the areas to continue until at least 2029, which will generate at least 20 more datasets. Instead of making the audience download the new datasets manually, BGC’s web-based approach allows BGC to add these datasets continually on their end so that they are available immediately the next time their audience logs into the web-based GIS map.
BGC’s combination of high-accuracy data from the terrestrial laser scanner and rapid distribution via the web-based GIS map ensures that BC Hydro and its stakeholders will always have accurate and up-to-date information about the landscape around the Site C dam. This will enable BC Hydro to provide power to British Columbia with the dam while taking care of the local environment and residents.