Digital twins are becoming important data for buildings and infrastructure in cities, but a utility in Chile is twinning its power corridors and adding seemingly unrelated data to identify, predict, and avoid power outages.
We live in an era of combining technologies. For the past few decades, we have witnessed the most impressive movement of progress and advancement that humankind ever experienced. Take music for example, for thousands of years there was only one way to listen to music, when someone was actually playing it. Then, about 150 years ago the first wire recorders appeared and eventually the 78-rpm phonograph and the vinyl record came about. But over the past 50 years, or two generations, we have seen five ways of listening to music appear and become obsolete within our life span, namely the 33-rpm vinyl, the tape recorder, the cassette or eight-track, the CD, and then the iPod. Five in half a century. Now the Internet, the availability of Wi-Fi, and new methods to transmit large amounts of data wirelessly have combined to create streaming services that create an entirely new listening experience.
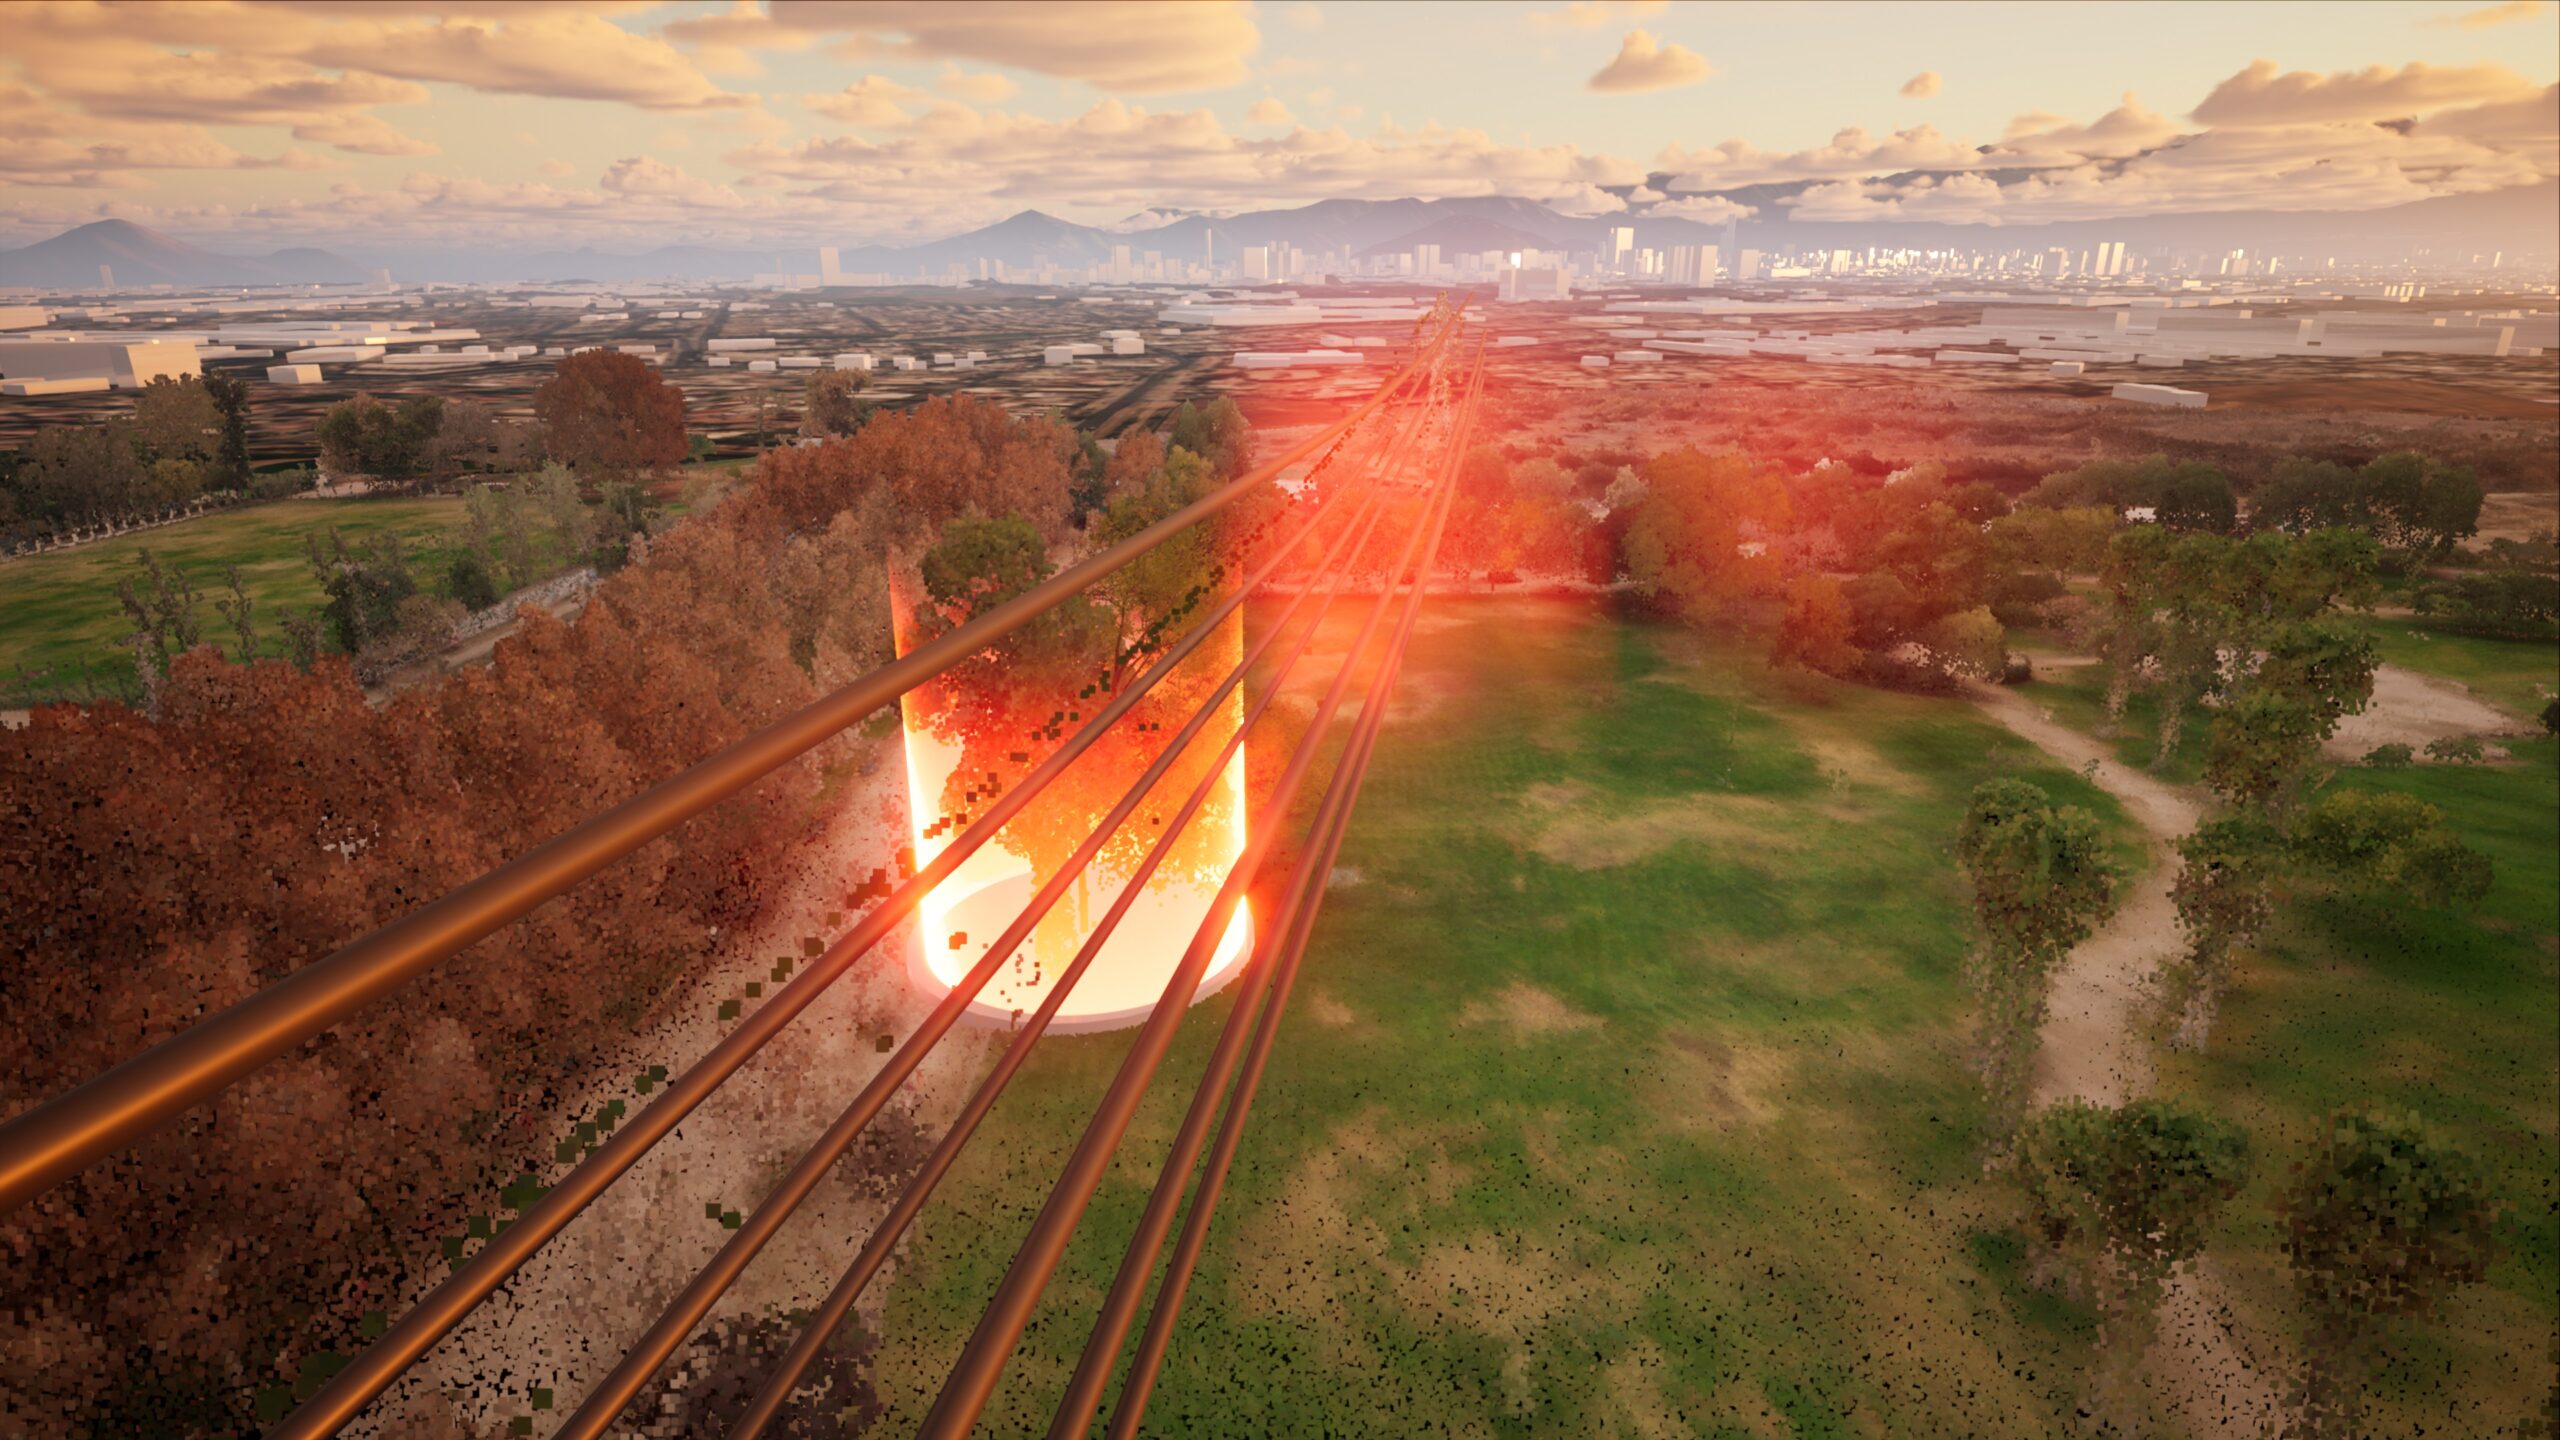
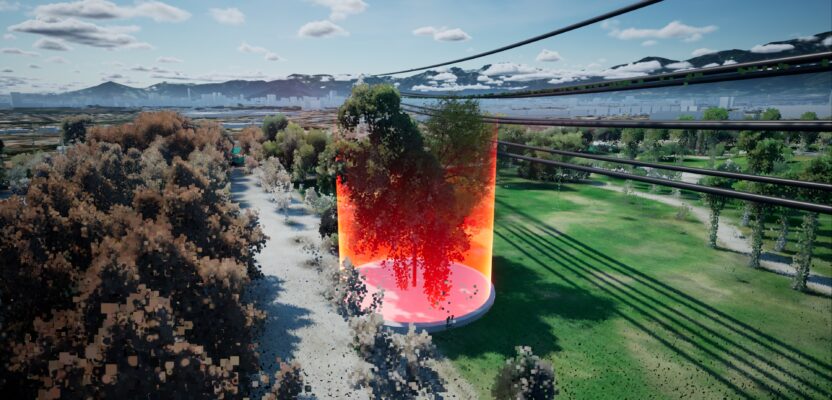
Trees that are too close to the powerline, representing a potential service interruption, are marked with vivid colors to make sure engineers see them and take appropriate, corrective action.
The same principle applies to land surveying. When I started my geodesy studies in the late 1970s, electronic distance measuring devices were crude and rare, and the transit and leveling rods were the preferred method to determine the distance between two points. In the span of 50 years, we have gone from leveling rods to laser transits, to GPS to lidar to drones.
And that’s only the field aspect of our profession. If we add the office side, the change is almost difficult to believe. I knew students who were graduating when I entered the university, who had used logarithmic tables and slide rules when they started their geodesy studies. During my years in higher education the first HP hand calculators appeared and eventually the first personal computer, the Radio Shack Model 1 (I still have mine at home.)
Today, every process is digital and even the large and heavy stereo plotters have been replaced by computer processes, high-resolution screens, and 3D glasses that perform the same tasks in one-tenth of the time and with more precision.
Artificial intelligence is making inroads in some classification applications, and the entire geodesy and photogrammetry industry is in constant renewal.
One great example of this mixture of disparate technologies is what happened when a group of innovators combined seemingly unrelated disciplines to create something new, namely the use of unmanned aerial vehicles (UAVs), the addition of lidar (light detection and ranging) sensors, weather information, arboreal data, and combined all the above in a simulation software.
Such is the case of Automapp (www.automapp.cl/en/) in Chile, which received a major contract to cadaster the entire high voltage transmission lines for the largest electric distribution company in a country that is 2,600 miles long, from the southern tip just 600 miles from Antarctica to Atacama, the driest dessert on Earth, to the north.
“It was a challenge of immense proportions to the team that had to put together the concept for a proposal, and an exercise in imagination and creativity,” said Nicolas Gonzalez, CEO and co-founder of Automapp, “We had to fly the entire distribution network twice a year and come up with a system that would dramatically reduce the number of service interruptions in areas that were notorious for the adverse weather conditions. We had to be creative and definitely think out of the proverbial box.”
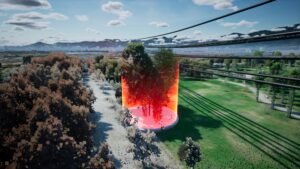
By creating a digital twin of the power corridor, trees, their size and growth potential are used to predict possible interference with power supply.
The original contract requirement was to fly the entire line twice a year. That gave the engineers preparing the bid an idea to save costs in the long term. The solution that Automapp came up with is ingenious in its simplicity of concept and incredibly complex to execute and manage. First, it was the flight and even though the initial plan was to use helicopters, soon the alternative of drones opened up and the team jumped at it.
“We consider ourselves an aeronautical company, and as such we have access to manned aircraft, but if we can use unmanned platforms, even better, because it reduces costs and accelerates deployment time,” said Gonzalez. “Knowing how much the aerial phase costs, we decided to prepare a proposal that would cut the flights from twice a year to once a year and eventually once every two years applying what we call Living Data. We have secured access to information that, at first look have nothing to do with electric distribution or land surveying, such as botanical data bases, satellite multispectral imagery, and weather stations and forecasts.”
And here is where the ingenuity of the solution comes to light. In a recent xyHt article we wrote about the importance of the digital twins concept in cities that have deployed GIS systems. Gonzalez and his team of engineers have taken the concept a step forward and have combined unrelated data to create a simulation mode that allows the electric distribution company to predict areas of potential service disruptions and prevent service interruptions.
“Sixty percent of electric service interruptions are caused by vegetal interactions. When we combine the botanical data with the weather forecast and the exact location and height of the electric conductor, we can precisely predict how a particular tree will be affected by wind, rain, or the snow. This combination of information can predict if there is danger of interaction with the electric wire, either by touching it or outright breaking it,” Gonzalez said. “The idea is to re-create the reality in the field and use it in a forecasting model to provide the electric utility managers with the ability to analyze an entire area in advance of extreme weather phenomena and to make decisions to avoid interruption while saving money by targeting specific trees instead of the entire area.”
By analyzing the tree species’ characteristics and the weather forecast, the system can forecast how much the trunk and the branches will bend and how that lateral movement might affect the electric conductor. A palm tree, an oak, and a scotch pine react to precipitation and interact with the wind in completely different ways. In the past, when a storm approached a section of transmission line, the electric utility company had to send various crews to clean the entire span of line about to be affected, now with the Automapp system, they identify specific trees in targeted areas and schedule field crew with precise X,Y,Z coordinates of each tree that has the potential to create service disruption.
“But is not only on the reactive side of electric distribution management that our system can help,” Gonzalez said. “We can also help the electric utility companies engage in preventive mode by recreating the exact conditions on the ground in our digital twin of the distribution line. When we add growth projection for the trees, we can now predict with certain degree of accuracy when the tree will become a potential liability. This is what we call Living Data and allows these engineers to monitor sections of the line and to look at them digitally with the same sun angle, exact weather conditions, and electric line movement, thus presenting an exact replica of the reality on the ground without the need of cameras or ground personnel.”
With all the processing being done in the cloud, Automapp has given the electric distribution company the ability to access these digital twins from anywhere, thus allowing for regional offices to take direct control of their section of the distribution line, therefore diluting the responsibility and workload on the head office.
“Now these managers can see the line as it is today with the exact conditions on the ground or create a reality a year from now that will take into account the growth of the trees during the selected period. It’s a revolution in terms of predictive models and a great tool for management to prevent service interruptions by monitoring in real time and periodically engaging in predictive prevention.”
There is no doubt that this concept of combining technologies and data bases, that at first glance look disconnected and unrelated, has given this electric utility the ability to become active in its preventive measures instead to reactive. Now managers and engineers can go back to listening to their music streaming services on their phones while they monitor this vital service to their communities.
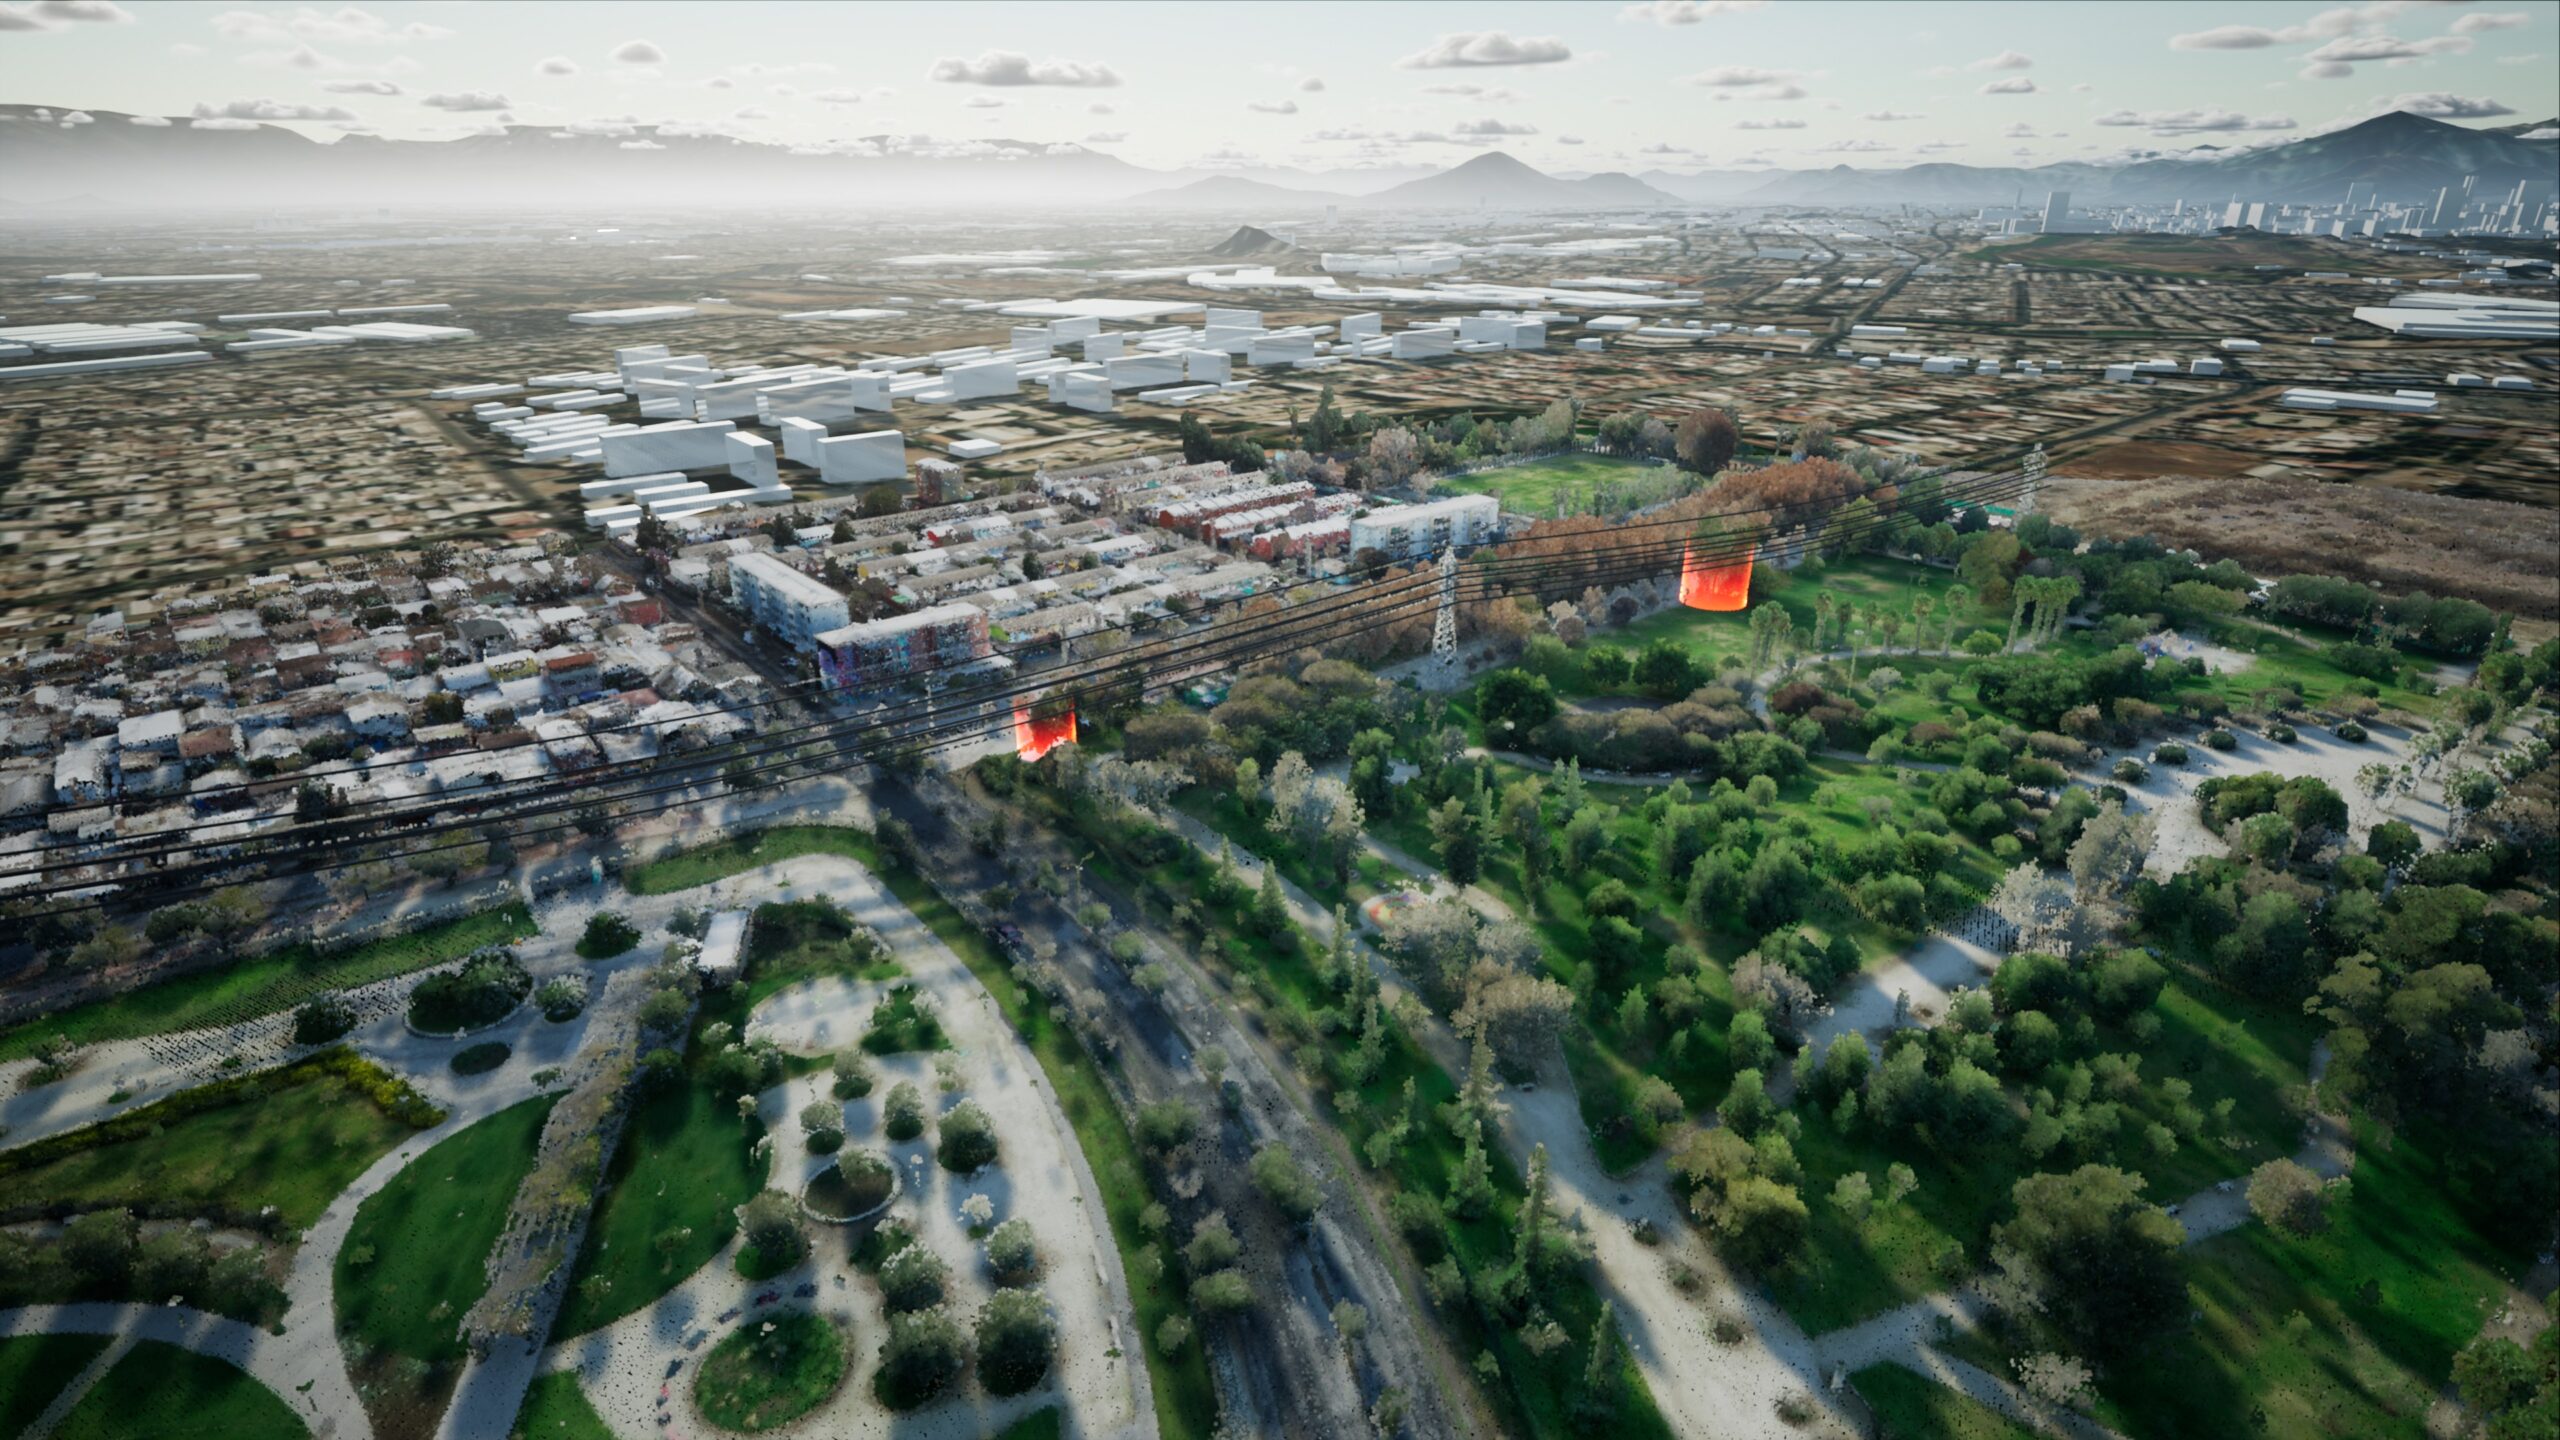
Identifying trees by size and species along the 2,600-mile power corridor in Chile is enabling the utility company to identify and predict possible damage during storms.