Using GIS tools and readily accessible satellite data to study rapid change in rivers.
Editor’s note: The dynamics of rivers can range from relatively stable to rapidly shifting, the latter especially in flood-prone regions exacerbated by a global increase in extreme weather events. The impacts are environmental, but also economic, social, and cadastral. Surveyors, for instance, are familiar with how avulsion, accretion, erosion, and channel dynamics affect real-property boundaries. While satellite data has been used for decades to study river dynamics, the wealth of readily accessible aerial and satellite data has empowered not only the scientific community but planning and geomatics professionals, as well. Here is an example river study, a summary of the author’s paper on this project. The paper can be read in its original format as an IEEE Xplore digital library publication.
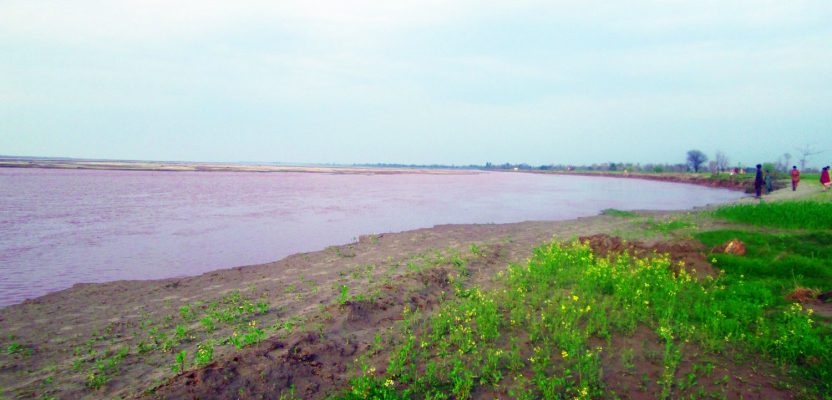
River channels change usually due to down-cutting of banks, erosion, and accretion. These are natural processes for an alluvial river, but they affect the structures and property along the river bank.
Often, rivers carry substantial amounts of sediment in the form of pebbles, clay, silt, etc. As floods create pressure over the bank side, river banks are eroded and create water dynamics. River erosion results in land-use and land-cover change because vegetation cover is also removed in this process.
Other regional development factors such as infrastructure construction on the riverbank, sand mining, bank revetment, artificial cutoffs, land-use alteration, and reservoir construction have changed geomorphologic movement of rivers.
This change deeply affects land use and land owners and can alter land tenures. The land owner no longer is able to render agricultural value if the farm area is eroded by river water and/or now part of a river channel. Matters of bona fide real property rights can become more complex.
Change detection of river banks and its measurement are studied through the application of scientific resources like GIS, remote sensing, and global navigation satellite systems (GNSS). Along with other modern technologies, GIS and remote sensing are abundantly used tools for monitoring and detecting change in the physical environment.
Satellite sensor data such as the Landsat dataset is widely used for the study of Earth surface processes such as glacier flow, internal process in volcanoes, fluvial systems, and coastal processes. Satellite sensor data is highly useful for change detection in the path of the river planform, especially at a large scale as satellites have capabilities of repeatable data and synoptic view. Rivers are continuous systems, so for the true demarcation and documentation of their structure and continuous time series data is required over a spatial and temporal range.
The Study Area
The Indo-Pak region is very vulnerable to natural disasters such as floods, droughts, earthquakes, and landslides. Floods are the most frequent phenomenon. Due to monsoonal floods and erosion of riverbanks, the Indo-Pak region loses a lot of agricultural land every year.
In this study we investigated Pakistan’s Chenab River channel dynamics throughout the channel of Chenab (Figure 1) with the help of remote sensing and GIS. These methods could easily apply to other flood-prone regions of the world (e.g. southeastern and midwestern U.S., the Amazon basin, and South Asia).
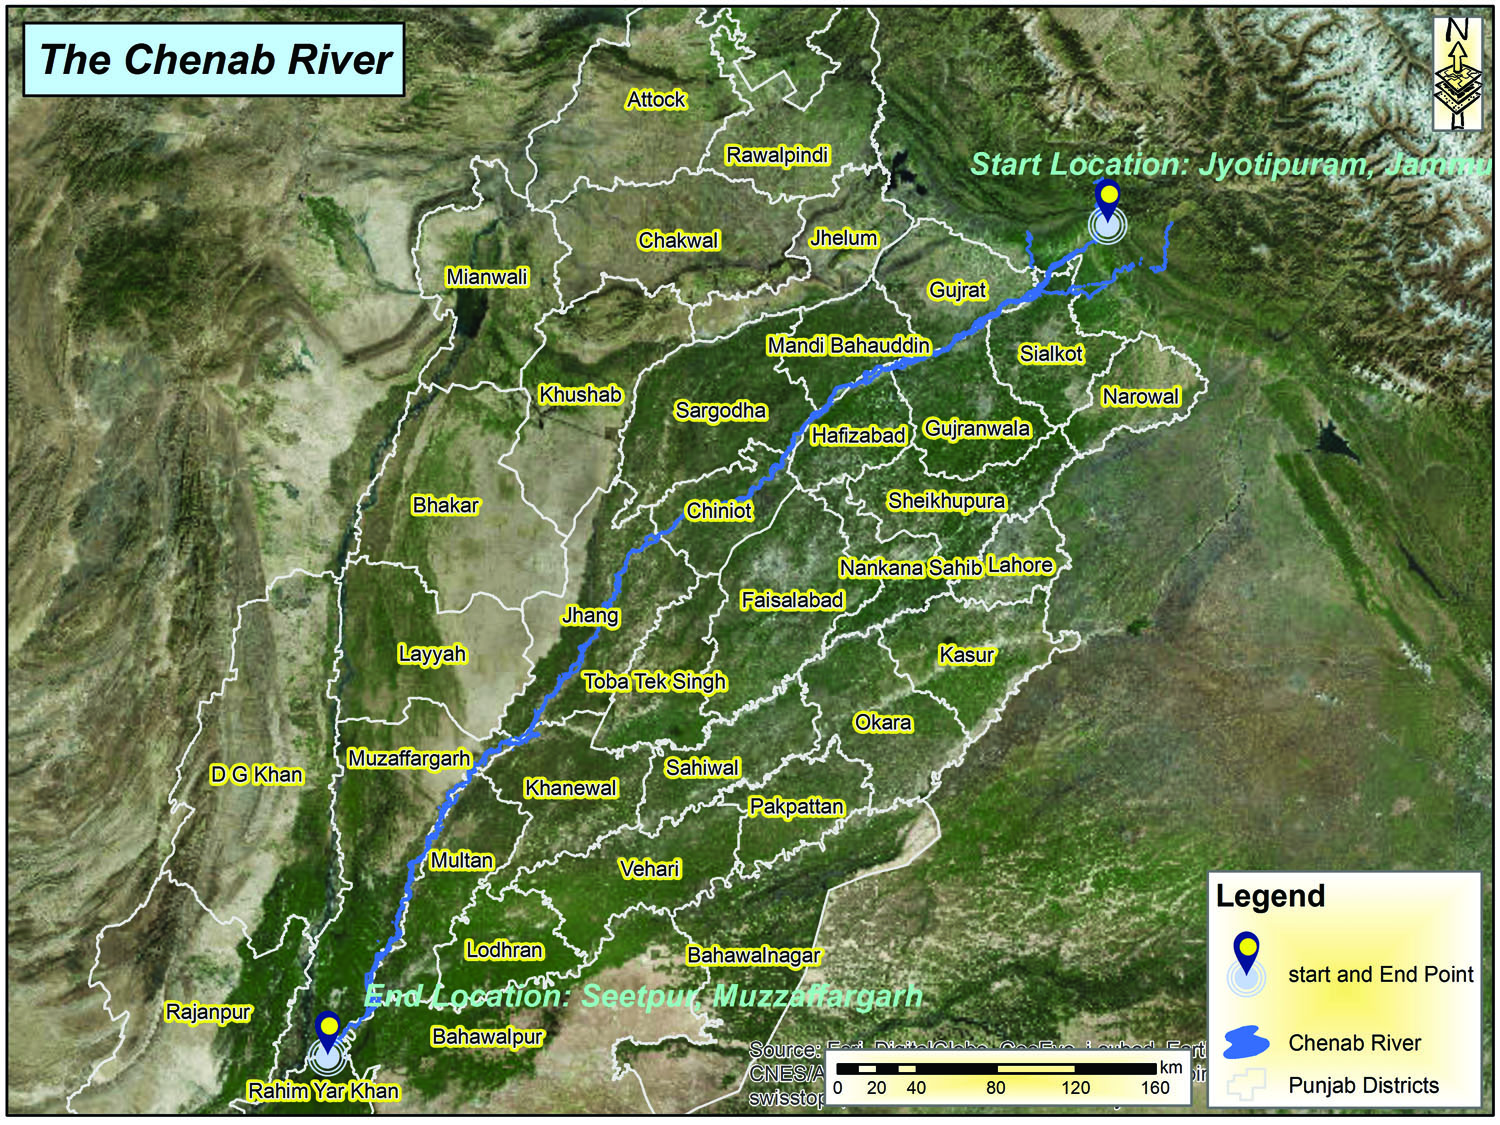
Figure 1: The study area.
Chenab is one of the most important rivers in the Indo-Pak region. Although it originates in the snowy Himalayan ranges, the final destination is in the province of Punjab, Pakistan. Pakistan and India both share the water of Chenab through the Indus Water Treaty.
Our study area of the river is about 974 km long. It has a vast irrigation network which is very important for agriculture and biodiversity.
This time span of the study is only two years. Although this is short, it was planned that way, and we discovered that the river channel changed rapidly due to the regional propensity for flooding.
Data and Methods
The United States Geological Survey’s (USGS) EROS center is the official source of Landsat data, with archives available online. Our study area lies in five pre-defined orbit paths and rows of Landsat images. For this study, a total of 10 satellite images from the Landsat 8 archive (five for year 2013 and five for year 2015) were downloaded (Figure 2).
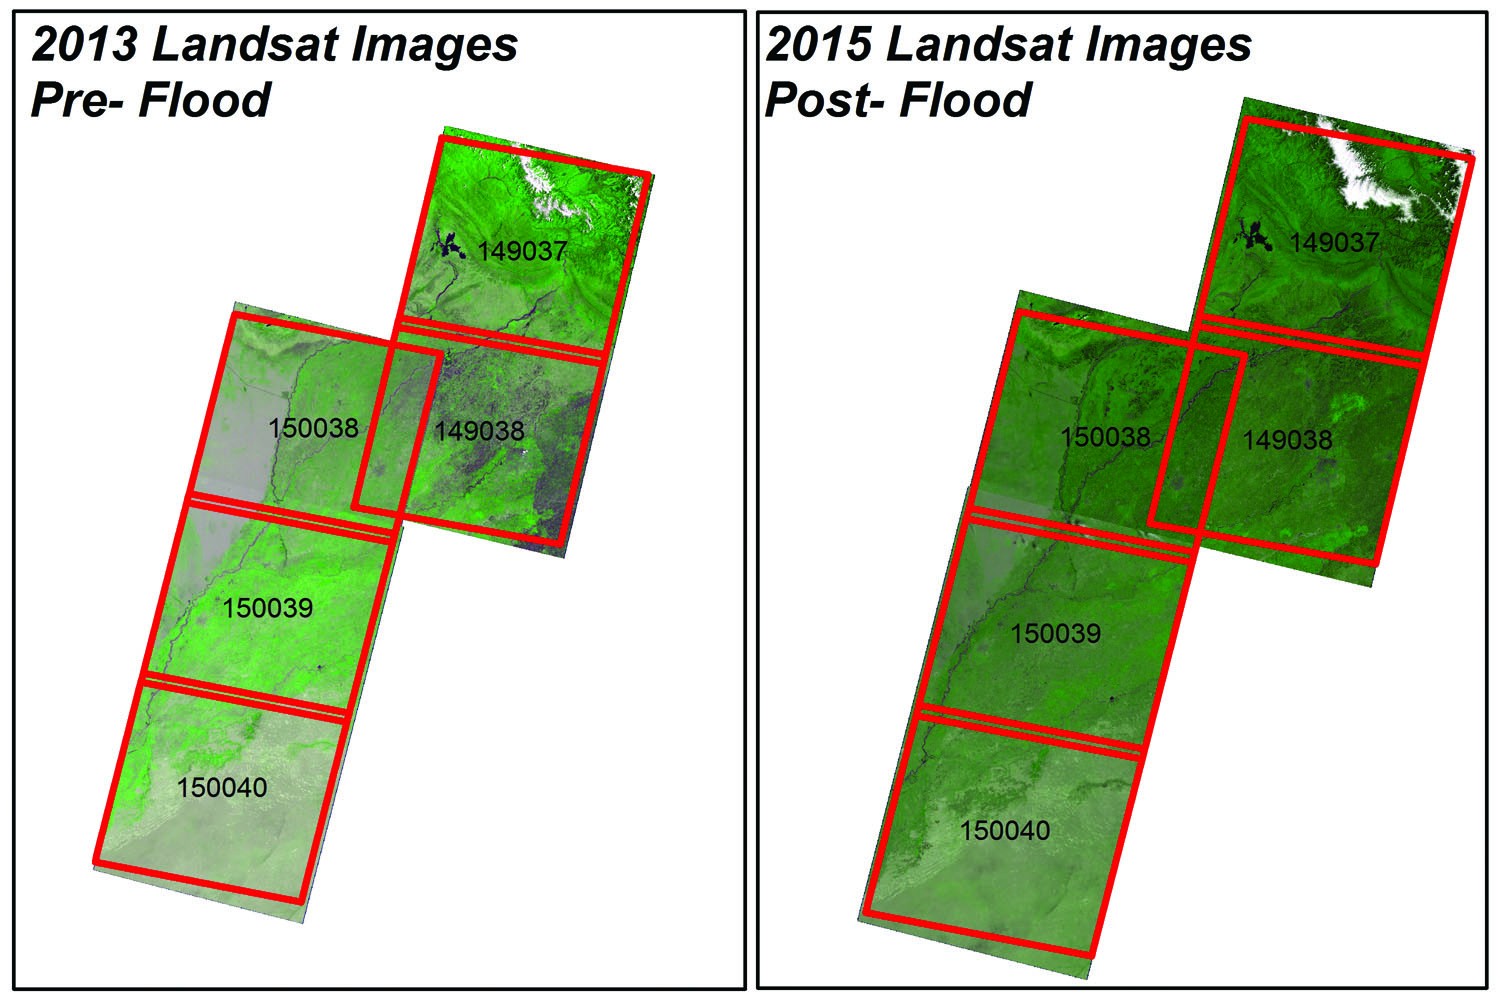
Figure 2: Landsat images used in the study.
We used the software ERDAS Imagine to investigate the images. After acquiring satellite images, we applied preprocessing, i.e. we converted Band 4 and Band 5 digital number (DN) values into top of atmosphere reflectance. The Landsat 8 OLI sensor is more sensitive, so this data is rescaled into 16-bit DNs with a range from 0 and 65536. We converted this data into reflectance rather than radiance.
We applied water index NDWI on these two bands to extract water from the images. The formula of NDWI for Landsat 8 image is: NDWI = Band 3 – Band 5/Band 3 + Band 5.
This formula of NDWI produces an image in which the positive data values are typically open-water areas while the negative values are typically non-water features (i.e. terrestrial vegetation and bare-soil-dominated cover). The classified images were further processed using ArcGIS software; we isolated water layers from other layers.
These layers were converted from raster into vector with the raster-to-polygon tool. These vector layers for years 2013 and 2015 were overlaid, and we made a line vector file where we got a shift. We calculated the length of these lines to get differences or shifts in river path. As there are differences of less than 200m, we applied only a spatial query and selected only the differences greater than 200m.
After applying this spatial query, we found that there are a total of 43 locations in the entire study area where the change is greater than 200m, starting from a minimum of 225m to a maximum of 2122m (more than 2 kilometers).
Results
After we analyzed the raster data and got output in the form of vector data by using the ArcGIS extension, we overlaid and compared the data layers of the entire study area. For closer examination, we identified five critical locations out of 43 that we knew had changed rapidly over time. Critical changes on these sections were revealed (Figure 3). We marked these five locations in the software by drawing polygons, and then we gauged the amount of river shifting and bank-line migration.
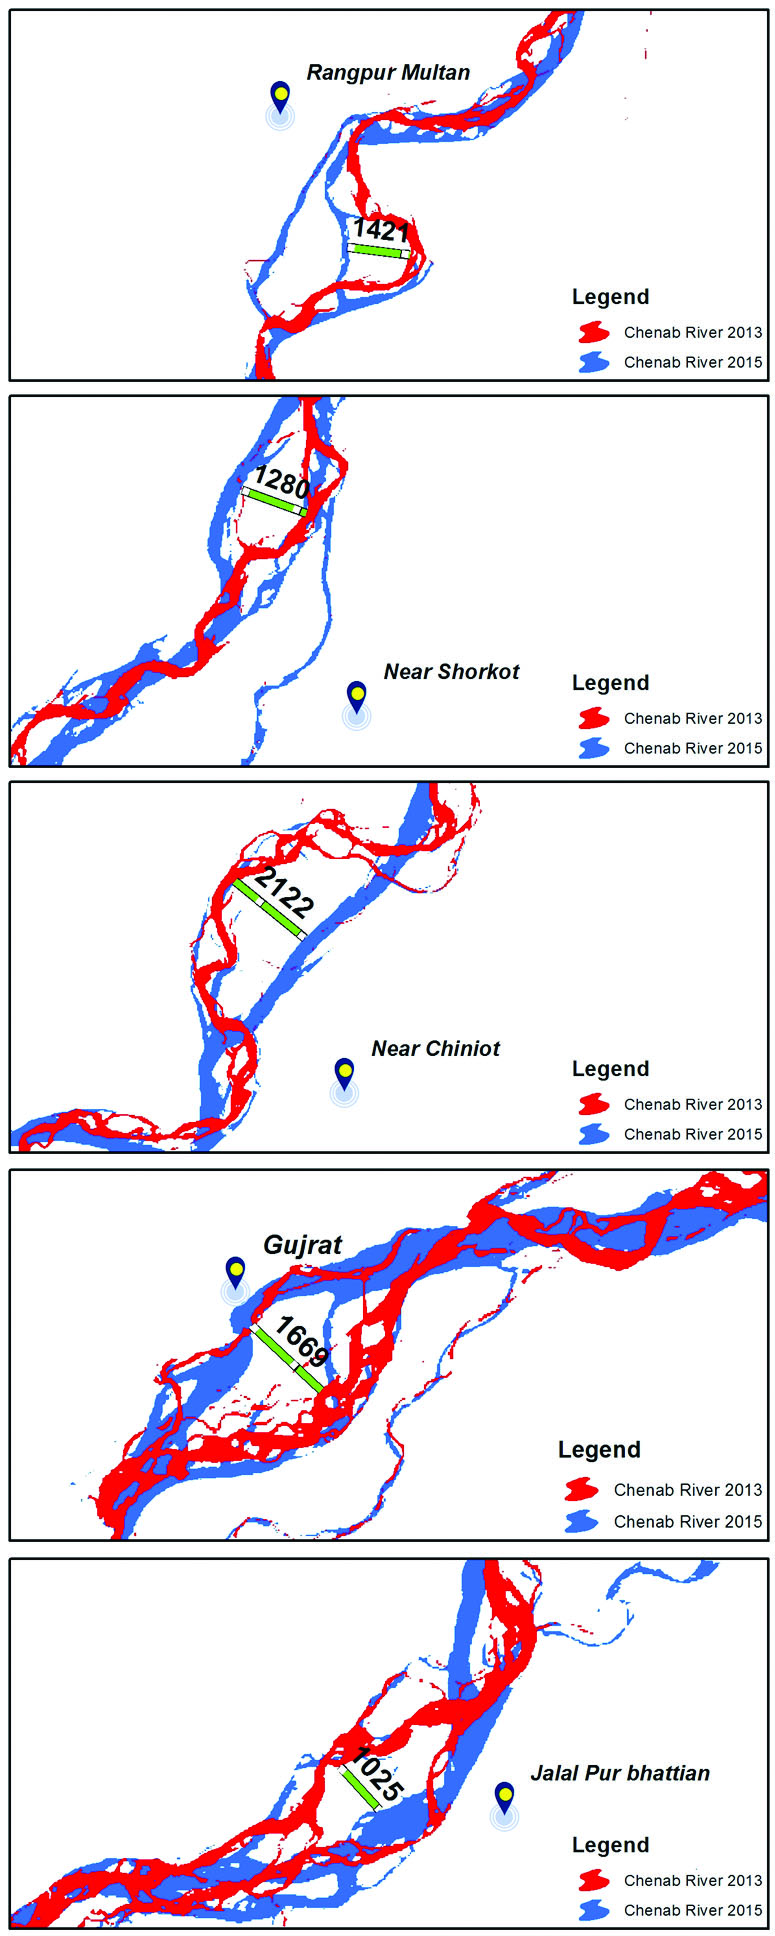
Locations with the most change.
Two of the five locations shown in Figure 3, labeled as A and E, are discussed below.
River path change at location A: At location A (near District Chiniot), a perpendicular line is drawn to the river channels for measuring river channel dynamics in the two-year span. It is clear from Plat A, Figure 3, that the change is 2122m, the maximum in our study area. After the flood in 2014, the river channel had shifted to downstream dramatically southeast.
River erosion at location B: At location B (near the district of Gujrat), perpendicular sections are defined to measure the channel shifting. From analyzing those shape files from two years we found that the water channel had changed up to 1669m.
Rainfall Data
By examining rainfall figures each month for the study period, we found that rainfall was more consistent during the months of August through October. Due to these heavy rains across the region, the water-level rose and dropped during the dry periods as expected, but extended periods of continuous rainfall caused the discharge values of the river to increase, culminating in flooding.
In 2014 and 2015, the pre-monsoon and post-monsoon seasons remained unusually wet, and rapid melting of glaciers contributed to the resultant flooding, as well.
Essentially, this study demonstrates how the multi-spectral data was used to identify areas of water inundation and saturation and hence is an effective way to gauge the areas of river change. This is something that might otherwise be difficult to do over a wide region with conventional aerial or satellite imagery alone. Likewise, terrestrial surveys of the entire river basin region would have been impractical and cost-prohibitive. The Landsat global coverage multi-spectral satellite data, with archives spanning decades, is a splendid resource for such broad regional studies.
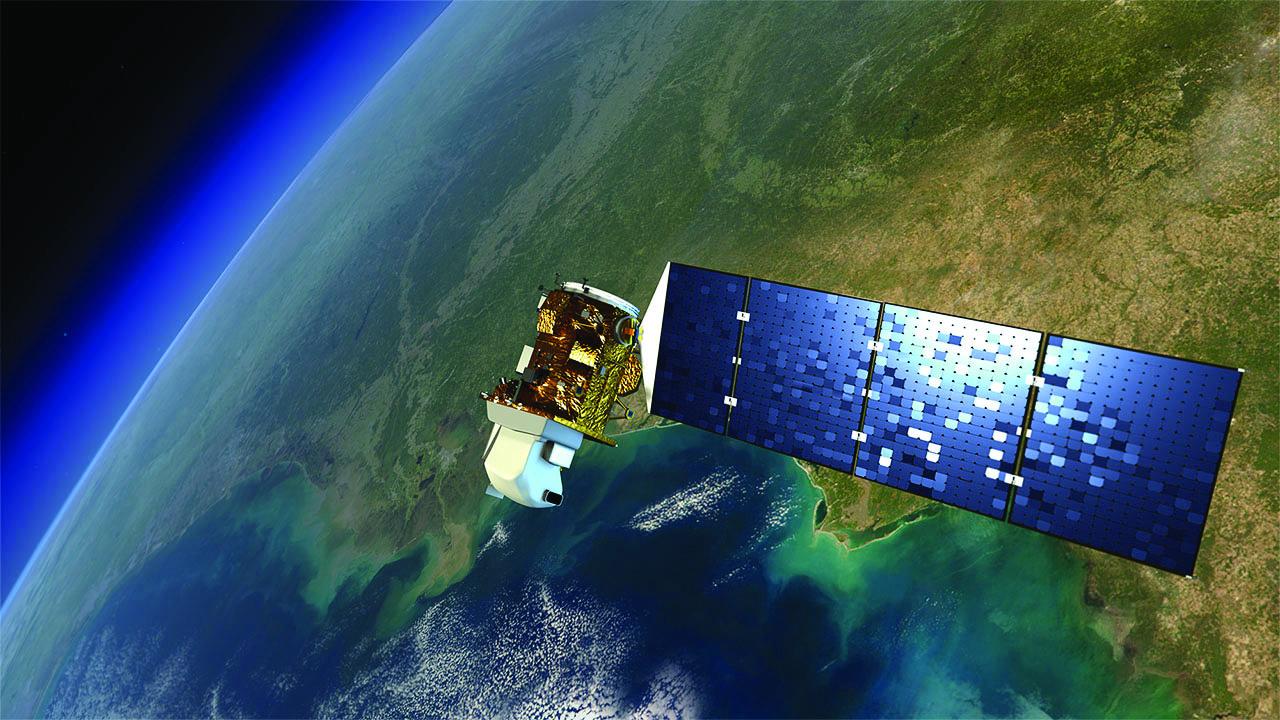
Landsat
For more than four decades, a succession of eight Earth observation satellites has served earth sciences and agriculture, cartography, geology, forestry, planning, resource management, conservation, and education. Originally a NASA program begun in 1972, operations were transferred to the U.S. National Atmospheric and Oceanographic Administration in 1979. The latest satellite, Landsat 8, in operation since 2013, has two sensors, the Operational Land Imager (OLI) and the Thermal InfraRed Sensor (TIRS). Landsat satellites have carried a variety of multi-spectral sensors, capturing reflected and emitted energy from the Earth in a wide range of the electromagnetic spectrum. Data is made freely available. If you have not yet worked with Landsat data, there are many applications in off-the-shelf commercial and open-source GIS software that could enhance your research, geospatial products, and services.