Breaking the Wall between Consumer and Professional, the Appearance of Disappearance, Versioning
An Interview with Lawrie Jordon
 Contrary to what the current buzz might indicate, GIS and CAD have been 3D-rich from their start (although sometimes with elevation as an attribute, not necessarily part of the core spatial definition). Even in the 1990s era of ArcInfo, the Grid module provided sophisticated 3D tools. New tools like 3D Analyst and CityEngine have arrived amid the explosion in readily accessible “Big-Geo-Data.” Perhaps the end-user constituencies and practitioners were not ready for a fully 3D GIS world.
To seek insights into this new emphasis on 3D for GIS we asked a GIS pioneer and Esri’s director of imagery to weigh in. Lawrie Jordan shares common roots with Esri founder and president Jack Dangermond; he first studied landscape architecture and then this relatively new field of GIS with a group of peers who would develop GIS as we know it today. Lawrie founded the successful GIS software firm ERDAS right out of grad school and now brings his leadership, experience, and passion for imagery to Esri.
Q: Why does the notion of 3D GIS seem like such a new concept to many users? 3D is not altogether new. What was missing in the past?
On a number of levels, many people were not ready for [it]. I’ll give an example: about 20 years ago I got into a bit of trouble at a [defense mapping event]. A subject up for discussion among these high-level participants was about the future of maps. I got up and said, “It would not be a map, but instead would be a photo-realistic 3D image.” That did not go over well—some folks asked if I was feeling okay. The idea was a bit too out of the ordinary; some people there were not ready for the idea yet.
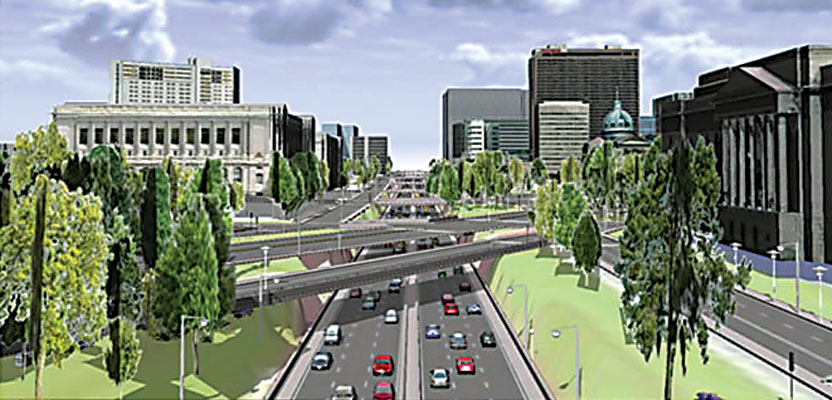
But here we are now with 3D everywhere and accepted at the consumer level, and we’re breaking down the walls between the consumer and professional. What people want from the [digital resources] and software is to be able to analyze and design for safer, happier, and maybe even entertaining cities but with authoritative data underneath. To be able to do that in 3D is really essential.
Is the expectation of 3D capabilities simply part of this ubiquitous nature of geospatial data?
Those expectations come with a sort of “appearance of disappearance.” An example is how computerization has become embedded into everyday life in consumer products. Think about the computerized systems in cars: chips that tune the car up as you are driving. We don’t think about those as computers anymore; they are just part of the car.
GIS has become part of everyday life: much easier to use and understand, and is [in] everything, including the internet and our phones. We get used to data being available, at our fingertips. Images and data for just about the whole world—this becomes a kind of digital living “planet” where individual maps “disappear” and seamlessly refresh.
People get used to those “global browsers” like Google maps, but what about more precise data that could be used for, say, geodesign or in CityEngine?
We are [soon to] announce a new “global 3D scene” where you can navigate around the globe, zoom in and see the high-resolution imagery and terrain from a world elevation source, but also we weave high-density 3D cities into this. This acts like a kind of basemap to begin analysis and design, but we call this a “scene” rather than a basemap as it continually updates.
This has presented a new business model, as well. We [are considering] offering access at different levels of detail [LOD]. At the first LOD would be the “canvas” with the basics: terrain and aerial or satellite imagery. The second LOD might be the untendered block models of cities. In the third we can add oblique imagery: aerial, sat, UAS—we drop the 2D and turn to the full 3D. The fourth could be BIM [building information management elements, interior and exterior].
How would you characterize the impact of this newly re-booted 3D GIS?
A term that often gets used is “disruptive” or even “destructive.” I’ll give you another analogy. Think about satellite imagery and digital photogrammetry and how big a jump that was over traditional stereo plotting. Soon there will be [even] nightly images from satellites. But more than just the availability of [very] current high-resolution data for … everywhere, this new 3D [GIS] is demonstrably easy to understand and analyze.
Is the 4th “D” next? There is the temporal “currency” of the data, but what about the spatial position of the data, say as a geodesist or surveyor would account for velocity (plate tectonics, subsidence, slump, uplift, etc.)?
Change over time [versioning] is a key area of emphasis, particularly in support of science data. ArcGIS in its [native] architecture supports time to model some types of change. Carl Steinitz [another GIS pioneer] wrote the book on geodesign [A Framework for Geodesign: Changing Geography by Design]. Carl is a leading authority on landscape change and landscape analysis. He has often said, “We should go straight to the fourth D.” Dynamic spatial change [like you are talking about with geodesy] is something that will be worked on. For now this can be managed through [versioning strategies].