We all have a little more time on our hands at the moment and it seems like the perfect time to do a little tidy of some of our data and do a little organization. In fact, I’m going to walk you through setting up something that clients have asked me to build for them on several occasions.
Most of us have a shedload of data that is stuffed on a cloud or web location catching dust, but why not make it useful? Why not plot it all on a live map that you see where you’ve captured and simply click on a feature to view it? Well, in previous blogs I’ve given you the power to create your own maps, this takes it to the next step and allows you to put the surveys on the map.
To do this, you will need to use QGIS, and we will use that cool QGIS2Web plugin. Therefore, if you haven’t got QGIS installed already, head over to QGIS.org and download it, then add the QGIS2Web plugin (See our previous post here)
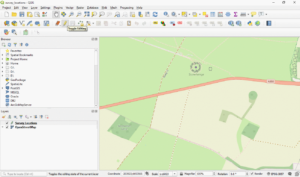
First, let’s create some points on the map which could represent some locations.
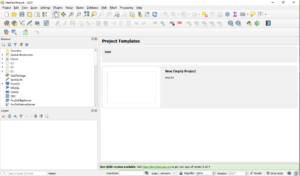
- Open QGIS and setup a new project, feel free to call it something like “Survey locations”.

- Apply a coordinate system, you can choose whichever is most suitable for you, just remember in the hit the “use map coordinate system” button when we get to the QGIS2Web stage.

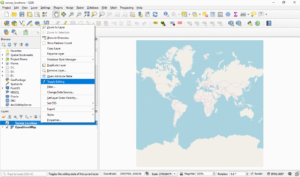
- Add a basemap – if you want to learn how to add lots of different basemaps to QGIS, see my previous post Using Openstreemap with QGIS 3.0 there is a comment which also helps add many different basemaps automatically!
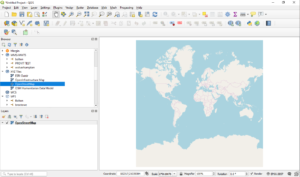
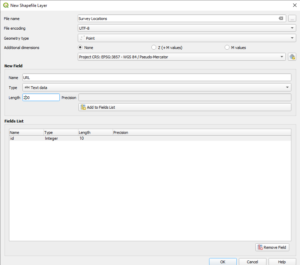
- Okay, so we need to add some points to a vector feature, so we need to create that feature. Go to the add layer, then select a spatial format, I recommend Geopackage, though shapefile will work fine.
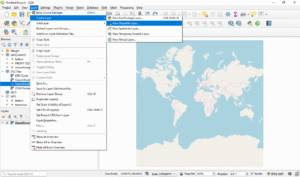
- Make sure you select “Point” type and add the field “URL”, we will use this for linking to the survey data.
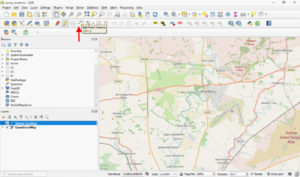
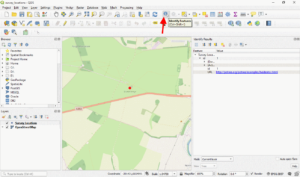
- Now that we have created the file which we are going to add the locations to, we finally get to add those locations. We do this by editing the data, within QGIS you start by hitting the pencil shaped button.
- While in editing mode, click on the three dots button which says “add feature” when you hover on it. Click the mouse on where you want your survey feature to be.
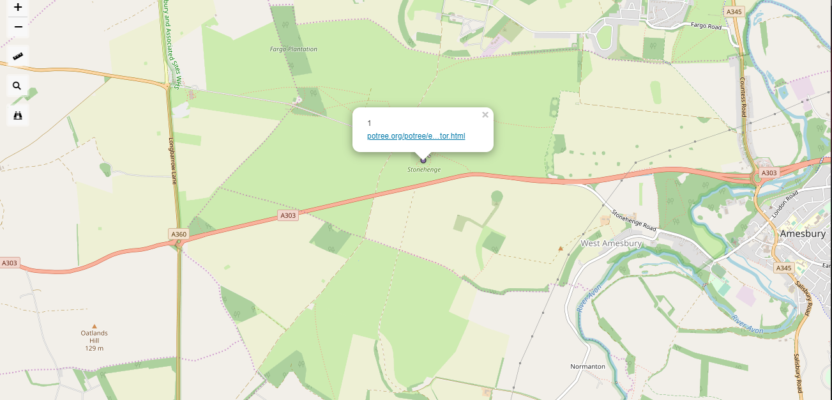
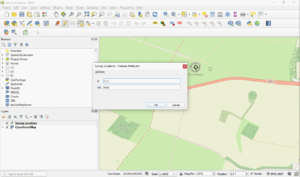
- Once you put the point down a prompt will pop up with the fields of the data, as this is the first point, add ID of 1, for the URL, put the web address of where your survey data is hosted. As an example, I have linked mine to a Potree example. Feel free to use this to test how it works.
- Now that all the information you want to add has been added, you will need to save your edits and stop editing.
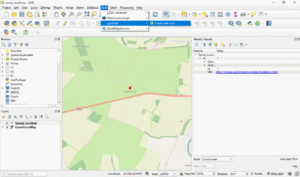
- Just to make sure it all works, click on the blue “i” icon and then click on one of the points you added, it should pop up with the “id” of the point and also the web address you added, if you click on that URL it should take you to your survey data. Congratulations! You now have a survey tracker map and we could simply save the map there and be happy…or we could turn it into a WEB MAP!
- Click on QGIS2Web, if you aren’t sure where that is, go and check my previous tutorial.
- On the “appearance” tab, make sure you select “Geolocation” as this will give you an address search bar and if you want to use this as a mobile application, then select the “geolocate user” option (highlighted blue) as this will find you using your GPS. Set your extent to full screen or you will find you only get half a map.
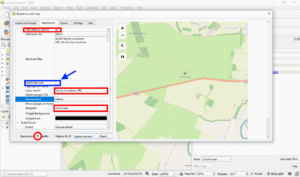
- Export as Leaflet and then put the folder the created onto your web server or website of choice so that you can easily access it.
Although this can seem quite daunting, it gets easier the more you do it and the great thing about this method it that you don’t need to be a developer to do it. If you have a little HTML knowledge, or you worked a little with websites, it is easy to put the map on the web in an iframe (a box on a webpage) or to add a little decoration around it. If you DID need to get a developer to help you, all the hard and expensive work has been done, so you are only looking at a small bit of time rather than $1,000s.
Updating the webmap is easy too, you just reopen the project you saved in step 1 and add/edit your information then export it QGIS2Web again, you can then just replace the webmap with the new one – how easy is that?!
Of course, you don’t HAVE to post it on the internet, you could just keep it on QGIS and use it to keep track of your surveys. You could even add a date field to the attribution so that you can find them by time, you could even link your invoice and survey specifications, there are so many options, I’d love to hear what you’ve created!
Dragons8mycat