In this series I’m describing a few of the different systems that mapping people use to share their web maps. Unlike many of the walkthroughs and tutorials out there, I’m including templates so you can fill in the blanks and learn how to put it on your webhost.
First in this series is Leaflet, a simple library that appeared around 2011. What caught people’s attention was how light and quick it was to use and get up and running with. As a reference, the simple map that we are going to build in this blog is less than 100kb, including data. In fact, the data accounts for 87kb and the script (a mix of html and javascript) is less than 2kb.
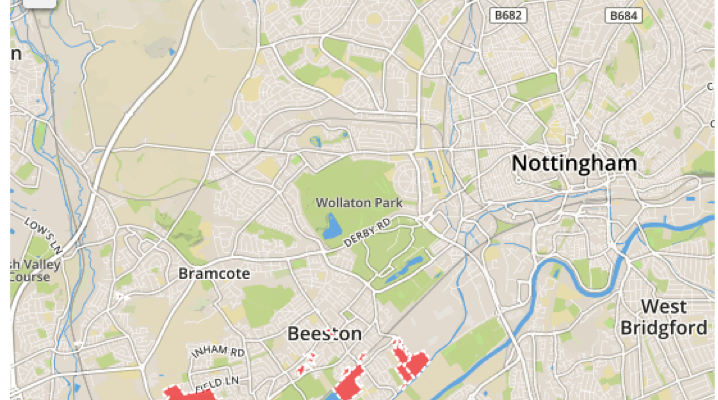
Leaflet is quick, flexible, and can use a variety of basemaps. We are going to be using a Mapbox tiled map as a base with some geojson data overlaid.
If this is already confusing, don’t despair. If you can open up QGIS and view your data in it, then you can simply export the data to geojson to be used in Leaflet (which is the method I used). Just remember that data works best in EPSG 3857 (web mercator).
Everything is controlled and defined from the html page. If you have never used html, don’t fear; it is a lot easier than you think, and the best part is that you can tweak and play until you are happy before putting anything near the internet! All you need is a text editor—I prefer Notepad ++ which is free and open source, then, rather than double-clicking on the html file, right click and open with Notepad ++.
Let’s Create an html Page
To begin, we need to get the page set up and ready to do the map stuff. Typically, a webpage is split into a header and a body. The header is where you normally see all the text, and the body is where you put maps—this isn’t true for all webpages. You can have multiple headers but for this we will keep it as simple as possible.
In the code below, the first line tells the browser that it uses xhtml. Next I say that it is the start of the header using <head> which must be closed at the end of the header with <head/>.
The next line (3) defines the character set as utf-8, and then I add a title to the page. If you open this online you will see the text appear on the tab at the top. Note that I define that the text is a title by using <title> then add the text I want to use and then define the end of the text with the backslash, using <title/>.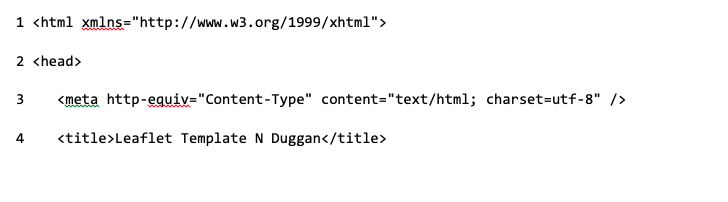 Next, we need to set the page up with the external scripts it will need to run Leaflet, so we put this in:
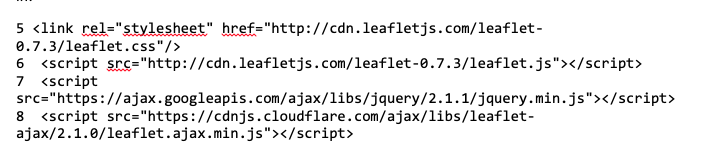 You will see how, in lines 6, 7 & 8, there is a reference to say, “go look for this script” and then the “src=” tells the browser where it can be found. In this case, I am using scripts hosted externally to make it easy for you to understand, but you can also download these scripts and use the same method to read the script from your hosting folder.
Give the Map a Size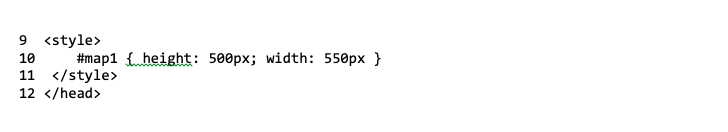
Between lines 9 and 11 we define the size of the map in pixels, feel free to play with these numbers and you will see how the size changes, also note how we open and close it with that same <> and </> method. In line 12 we close the header.
Set the Center Point for the Map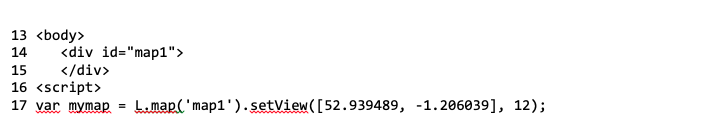
So, now to the fun stuff! In line 13 we start the body of the page—this is where we are going to put the map. Now note how in line 10 (above) we defined “map1” with a size; in line 14 & 15 we set it up as a division (div) within the body of the page; we then start the script for drawing up the map (map1) and tell it with “setview” where we want the map to be centerd in latitude and longitude. The last number, 12, is the zoom scale—and there is a really great table that refers scale to zoom levels here: https://wiki.openstreetmap.org/wiki/Zoom_levels.
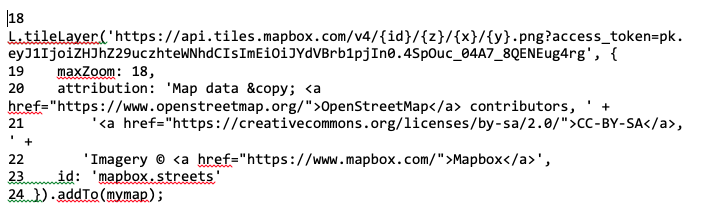
In line 18 we define the basemap we will use. In this case we give the url of a Mapbox basemap, but you could also try others by just swapping the code given on this webpage: http://leaflet-extras.github.io/leaflet-providers/preview/
In lines 20 to 23 we add copyright attribution to the map, and then in line 24 we close it off by telling it to add to my map.
Adding Our geojson Data
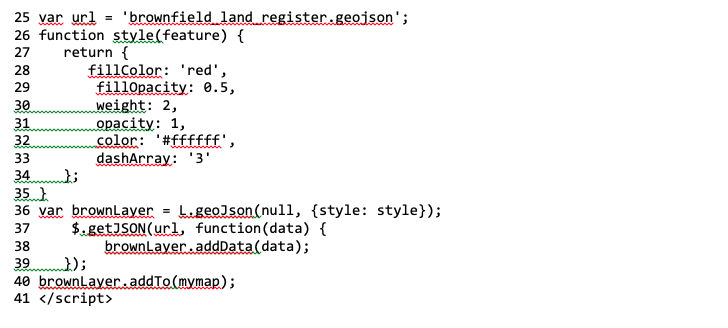 In line 25, we create a variable and tell the browser its url. In this case the geojson file is directly in the folder with the html page. You can use absolute paths to describe where the file sits or even use a backslash to say it is a folder down.
We then give the data a style from lines 26 to 35. This should be easy to understand, though please play around with it to see how you can change the color and transparency easily.
Then in lines 36 to 40 we add the data to the map, and then end the map script in line 41. All that is left is in lines 42 & 43—we need to close off the body and define the end of the html. If you have just copied all that into Notepad ++ then you just need to “save as” html OR (this is a little trick I learned a few years back), you can save as text (for example page.txt) and then just change the txt to html (for example page.txt to page.html).
To save you some time and all that copy and pasting, I have put a copy of the template here with notes added to the lines. You will need to provide your own geojson file (in EPSG 3857 projection).
Putting It on the Web
To put the data on the web, you will need a website or an area accessible via url where you can put data. Many hosting companies like GoDaddy, Wix and others provide webhosting with CPanel and FTP access; this will allow you to add files on the internet and give them a url.
If you are used to using the folder structure in Windows, then using CPanel through your webhost might be best, but I use the open source software Filezilla as it is real easy and quick to drag and drop data into, and it means I don’t need to open web pages.
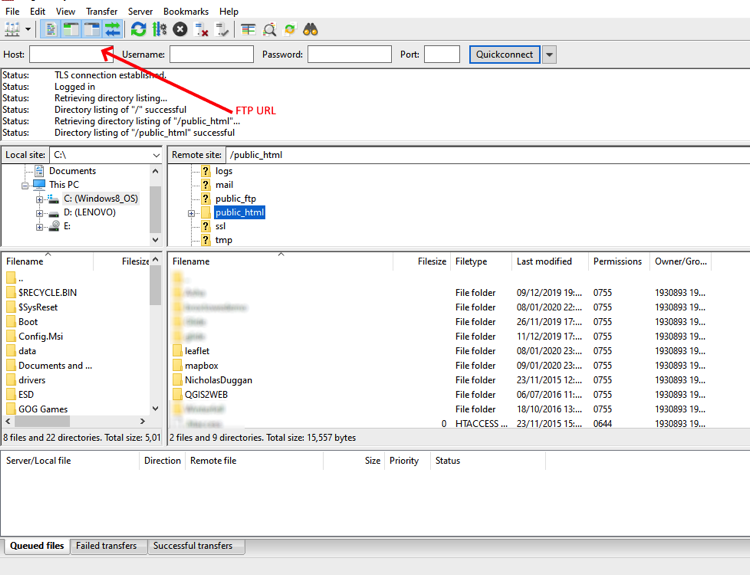
Here you can see the folder structure of my webhost through Filezilla. The box top-right shows the folder and the box below shows the contents. When adding data that needs to be seen on the web, you will need to place it in the “Public html” folder.
Each folder you add to your “Public html” folder will create a new sub area. Let me explain. I own https://dragons8mycat.net and if I add a folder called “mapbox,” the contents of the mapbox folder will be within https://dragons8mycat.net/mapbox. Therefore, if I wanted to put my leaflet map on the internet in an area called “leaflet” and I wanted people to open the html that I called “leaflet.html” then I would create a folder called “leaflet” and within it put the geojson file and the html file. I would then drop that into my “Public html” folder. People would then be able to go on the internet and go to http://dragons8mycat.net/leaflet/leaflet.html to view the map.
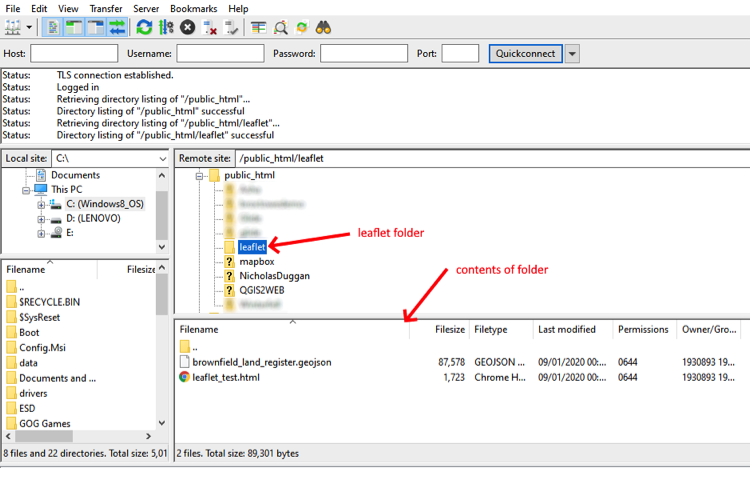
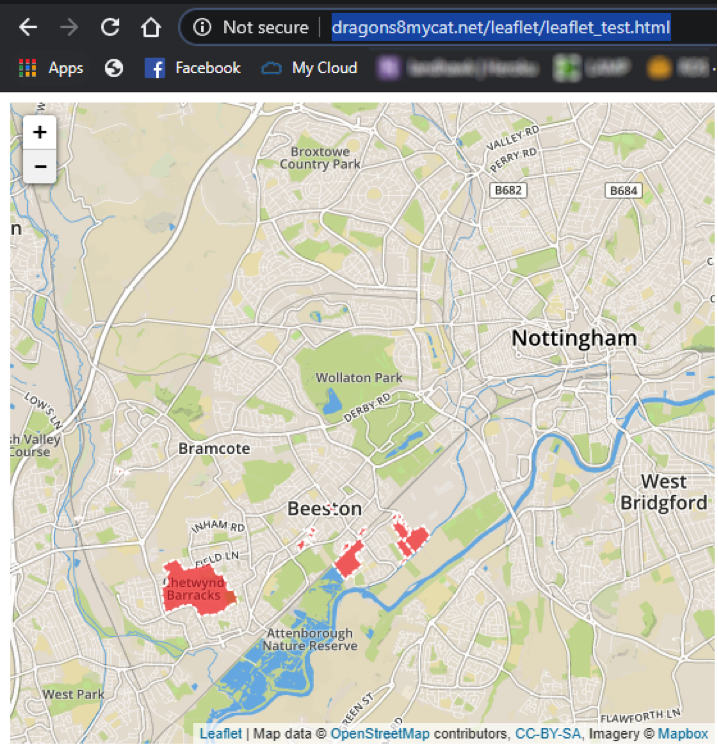 The two pictures above show how the folders are referenced to the website and how is should appear on the web in the picture above.
Here is a link to the template