Part 1, The Basics
Children of the millennium will never know that there was a time before the internet when we, the cartographers, engineers, and surveyors had to relate geospatial information through the medium of paper.
Although the internet has been around since the late 1980s, it wasn’t until 1996 when the world got the first commercial Web map, the rather clever and popular Mapquest that provided maps as well as routing information. This was shortly followed by the UK Multimap that offered a similar service.
For the first time, although rather slow over the 56k broadband, people could go onto the internet and scroll around maps and plan their journeys far quicker and easier than ever before. Rather than skimming through street maps or the popular street atlas, people could go online to get their directions turn by turn and relate that to a map.
It was almost five years later, in 2001, that Google Maps appeared, with the possibility to start receiving maps through the new invention of the smartphone. Internet-based maps went from being a novelty to being a practical and important way to start sharing geospatial information. Soon, Esri announced the release of their new internet mapping service, ArcIMS 3.0, while Geoserver released an edition that used a new open-source database system called PostGIS. Shortly after, UMN Mapserver released their latest edition with support for OGC WMS.
It comes of little surprise that businesses saw the benefit of having their own internal mapping services with which they could share information on a business scale and get answers and relate geospatial information so much faster than ever before. In as little as 10 years, Web mapping has gone from a tool that could be built and distributed by a select few to a global business where there are Web maps that the casual user can build with little or no Web knowledge.
Types
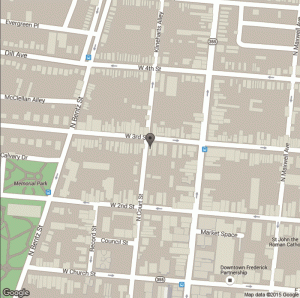
This Google Maps screen cap is an example of a static map.
Before I discuss the business-end of things, let’s take a minute to understand the types of Web maps now available. Whereas a decade ago the only map with more than one dimension was Google Earth, now there are 4D maps and even 3D streaming Web services.
Web maps themselves fall into really only two categories, static and slippy.
Static
This, as the name implies, is commonly a single image that is made available through an internet address. There is no API (Application Programming Interface, an interface that allows the user to access information from another web service and allows the user to integrate this service on their own application).
The static Web map is commonly very basic and may not even include controls for zoom or pan. Many organizations, such as map libraries or tourist information providers, make their maps available in this way. This way of presentation can be very useful, for example, to make historical maps more widely accessible.
Slippy
Although the true term for these maps is “slippy,” the most common term used is “interactive.” These maps commonly use an API and provide maps using tiles to improve efficiency. By adjusting the number of tiles drawn with each refresh, or zoom level, larger and more complex maps can be created without failing due to bandwidth.
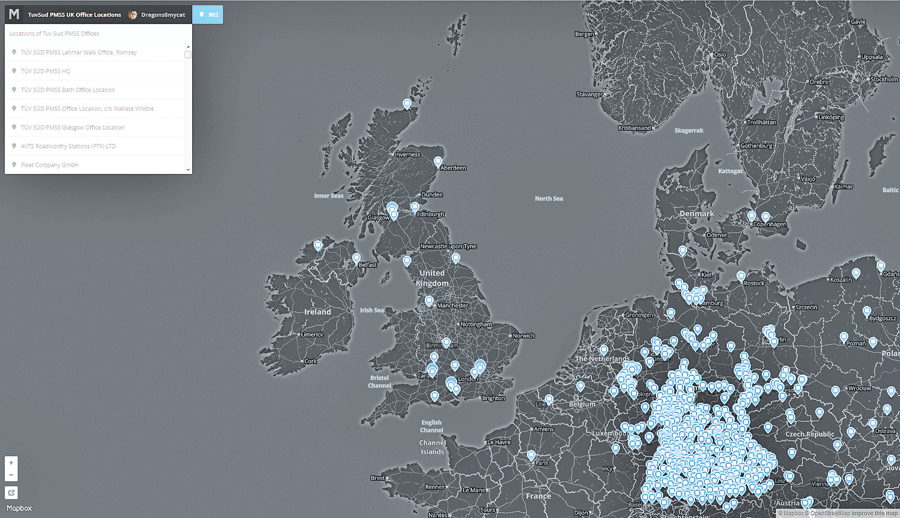
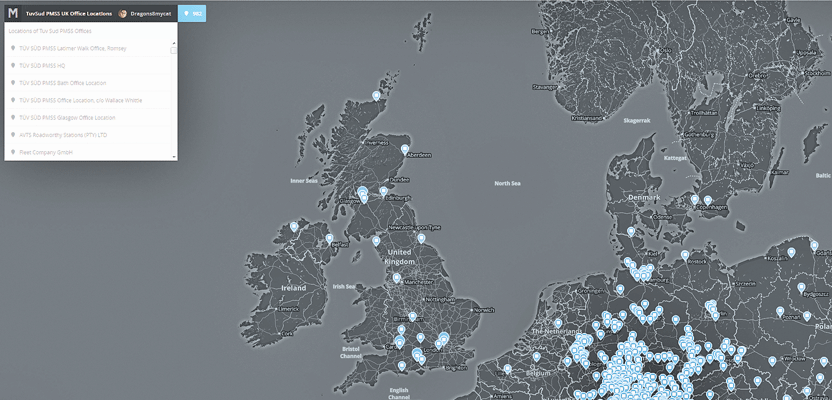
This Mapbox image is an example of a slippy map.
Map services such as Bing or Google Maps could be referred to as slippy maps; many organizations use these types of maps to show information that may span several scale ranges.
With the update of Web browsers to utilize HTML 5 circa 2013 came the ability to use the WebGL (Web Graphics Library) 3D graphics API, enabling the rendering of both 2D and 3D graphics. The WebGL API has been the basis for most of the 3D Web maps. For example, the Esri 3D webscenes, the Cesium 3D worlds, and the 3D OpenStreet Maps would not be possible without this API.
What’s It Made Of?
Although modern Web maps may seem immensely complex, they in essence comprise just a few components. It is the way in which these components are leveraged that provides such stunning and involving results.
The three primary components are a webpage where your map can be seen, a [web]server (or rather something that converts the data into something that the webpage can read), and finally somewhere to store the data.
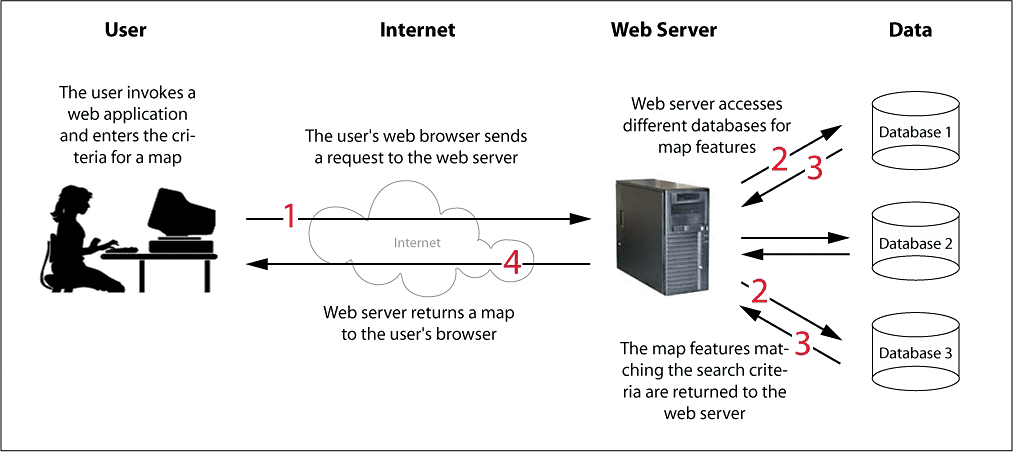
Simple diagram of a web map system.
Webservers
Commonly, Geoserver, ArcServer, or Mapserver may be used as the server or tool to translate and render the data. Although Geoserver and Mapserver are open source and free to use, they have been used commercially for over a decade by some of the world’s top companies. Both provide easy installation and configuration options, including lots of documentation.
ArcServer is the most popular commercial package; Esri (the suppliers of ArcServer) provide full support and will provide a fully customized solution, the only limitation being your budget.
Data storage
Open-source geospatial servers tend to use PostGIS as the storage format. PostGIS is a software that enables geographic support to the widely popular PostgreSQL. Although PostGIS is open source, it is an extremely robust and efficient storage system that works well in the cloud and can be consumed by most GIS software like QGIS and GRASS. The popularity of PostGIS is such that Esri now uses PostGIS with the ArcServer.
There are many other proprietary data storage systems for Web mapping, the most popular being Oracle Spatial and MySQL. For simpler Web maps, it is possible to also use shapefile, Geojson, GML, or other formats, but the issue will always be finding suitable and/or secure places to store the data so it can be read by the server. There may also be issues with speed as more data is used in system. Spatial databases tend not to have as many issues due to the way in which they index the data and serve the data to the Web page.
Although the above text describes a simple system, it is anything but. The modern webserver alone has to be capable of multiple coordinate systems, operating systems, and hardware configurations, which is why Web mapping systems are seen as a right of passage for many GIS technicians and consultants.
Help is at hand though. Over the last few years developers have realized the need to fill the gap in users’ knowledge and provide “off the shelf” solutions. There are ready-built solutions that require you to add only some data to make it bespoke. There are systems that I like to call “half built” systems that provide the complex aspects in a easy-to-use solution; more often that not, you need provide only the data and webpage. Finally, there are “stacks”: whole systems that can be installed as a complete package, in a similar way to installing a new software. Stacks often include all the necessary components including matching versions (this can sometimes be an issue).
The two primary considerations to make when building a Web map system will be cost and knowledge. It is quite easy: if you have the knowledge, you can make a web map for almost no money at all, whereas if you buy into a ready-built system, the costs can quickly escalate.
Tools
Ready-built solutions:
Half-built systems:
Leaflet, Mapbox, CartoDB, QGIS Cloud
Stacks:
ArcGIS Server, OpenGeo Suite, GeoMoose
I’ve put together a simple functionality matrix that highlights some of the considerations many of us make when considering a Web map system.
Part 2 of this series covers free and easy Web mapping.