On July 4, 2019 the desert region near Ridegcrest, California was hit with a magnitude 6.4 earthquake, resulting in minor damage in the area, most significantly to the infrastructure at the Naval Air Weapons Station at China Lake. Approximately 44 hours later on July 6th, a larger earthquake of magnitude 7.1 struck the region, causing additional, much more severe damage. It is my understanding that the sequence of magnitudes of the events was quite unusual with the larger earthquake occurring after the initial one. The area has been hit by more than 80,000 measurable earthquakes since July 4th.
Fortunately, there were no deaths or serious injuries in the immediate area, primarily due to the region being sparsely populated. Had earthquakes of this magnitude centered in the Los Angeles or San Francisco Bay areas, the toll on people and infrastructure would most certainly have been catastrophic. For these and other reasons, I have heard the scientific earthquake community refer to the Ridgecrest event(s) as the “perfect earthquake” for scientific study. I am not sure that the Navy would concur, as operations at the China Lake facility were interrupted due to the damage.
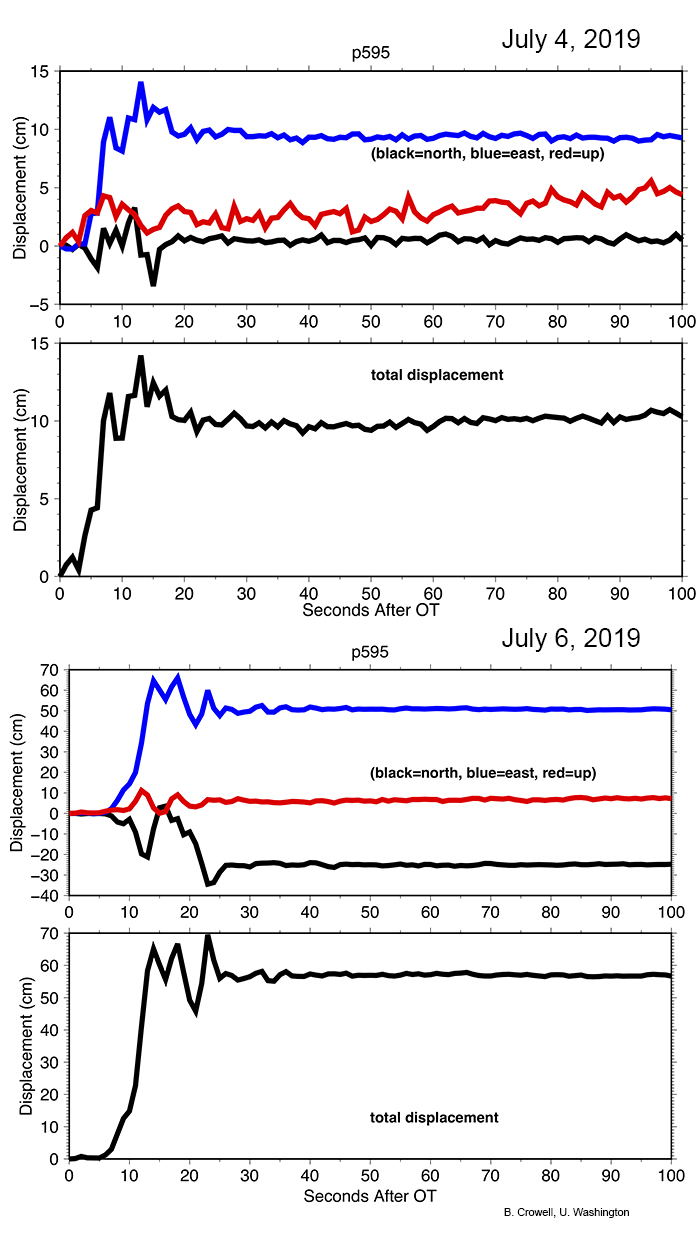
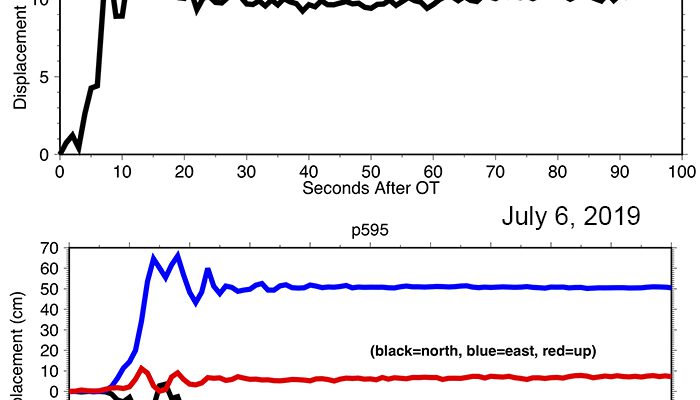
Time series plots showing the offsets of station P595 for each of the events and the total, as produced by UNAVCO.
Although you will find nothing about it in any news accounts, there was additional damage in the form of the disruption of the geodetic fabric in the region, radiating out from the epicenter for more than 100 miles, depending on the threshold applied.
After any large seismic event, repairs to infrastructure are often needed, specifically highways, bridges, utilities, and possibly to re-establish boundaries. In these instances, it is critical to know “where” you are with regards to mapping and locating underground facilities and other applications that rely on precise positioning, such as change detection. With the surrounding geodetic control having been displaced, precise positioning can be challenging.
In the case of the Ridgecrest events, the nearest NGS CORS was approximately 22.5 km from the 7.1 epicenter, and a second CORS was around 23 km away. The nearest non-CORS Continuous GPS (CGPS) station, P595, was some 25 km away. Interestingly, the slightly more distant non-CORS recorded the largest co-seismic displacement of the three (more than three times that of any other station), with a total displacement of 0.80 meters (2.64 feet), most of which was to the east (0.76 m). Although closer in proximity, CORS CCCC recorded a total displacement of 0.24 m (0.77 feet), and CORS P594 recorded a displacement of 0.17 m (0.55 feet). The vertical displacement of stations was minimal in all cases with a maximum of 3.3 cm recorded at P595. All others were under a centimeter in the vertical.
Fortunately, the nearest real-time station in the California Real Time Network (CRTN) was approximately 84 km from the epicenter of the largest earthquake, and the displacement at the station was minimal at about 3 cm. Again, had the epicenter been elsewhere, streamed real-time positions would have been significantly disrupted. With the evolution of so many technologies reliant on real-time positioning, such as autonomous vehicle navigation, this could present huge problems in high-population areas following a major earthquake for long periods afterwards.
So, what do we do about this disruption to the geodetic fabric? The first step is to compute daily positions for the stations in the International Terrestrial Reference Frame (ITRF) as quickly as the data is available (communication may also be interrupted in a large event, crippling data transmission). This will help determine the total offsets at each station as I have described above. It will also allow for tracking post-event movement over time to evaluate the positional “behavior” of the stations. If they are moving significantly and erratically, computing provisional coordinates for positioning needs would be problematic because coordinates would essentially require a date and time stamp for the moment in time for which they were computed. During this interim period of instability, the most reliable positioning solutions will involve using distant stations outside of the area of instability, even if that requires using less-than- optimal long baselines.
Once the disrupted stations start to positionally stabilize, meaning their time series plots have closely returned to a pre-event secular velocity condition, a new provisional epoch date coordinate can be established for end users to rely upon. This will ensure that their new data collection is on the datum they desire, allowing for resurveying of passive survey control in the area to update positions or perform change-detection mapping using remote sensing techniques.
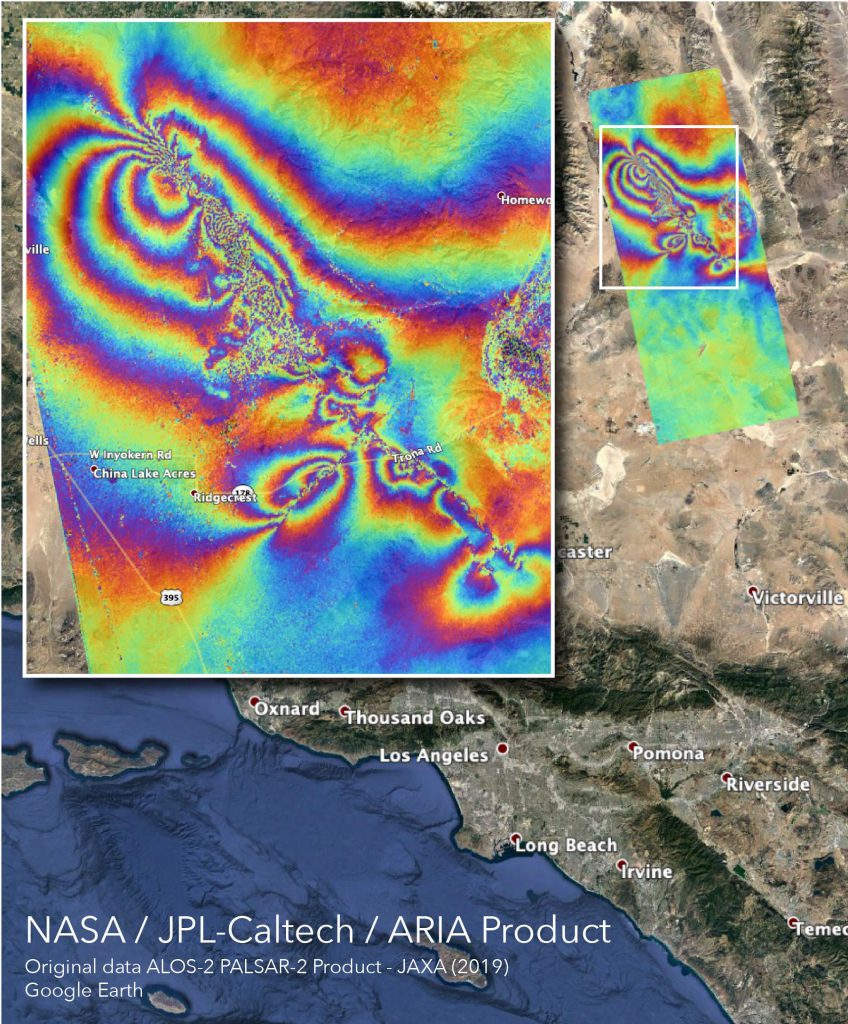 One discussion I have been involved with is to combine the offsets computed at the discrete CGPS/CORS stations in the area of disruption with an InSAR interferogram across the region to develop a positional change model. The model would then be used to compute new positions for the passive survey control in the region. (For more on InSAR as used here, see the Maps as Art column in xyHt’s September issue).
A field observation campaign on a strategic subset of those passive marks would be performed, and the surveyed positions would be compared to the modeled positions to validate, or not, the accuracy of the model. If successful within a reasonable tolerance, the model could then be used to compute new positions for other desirable features, as needed.
Hopefully we have the opportunity to learn much from these events so we will be prepared for something similar in an urban setting. If so, perhaps this really was “the perfect earthquake”?
 This article appeared in xyHt‘s e-newsletter, Field Notes. We email it once a month, and it covers a variety of land surveying topics in a conversational tone. You’re welcome to subscribe to the e-newsletter here. (You’ll also receive the twice-monthly Pangaea newsletter with your subscription.)