How to do enterprise inventory management from image-based 3D reconstruction, in the cloud and in your pocket.
“No one wakes up in the morning thinking that they need to buy a point cloud,” says URC Ventures CEO David Boardman. “Most people would be thinking that they need to solve some business problem.”
What URC Ventures has done through their branded Stockpile Reports service is to address a very pressing business problem. At first glance it looks like, “Wow! An iPhone app that measures stockpile volumes!” The real story lies in the maturing of automated image-based 3D reconstruction, the robustness and reliability of such technologies, and more importantly, how this replaces legacy (or sometimes non-existent) stock inventory management systems.
Stockpile management has traditionally relied on semi-annual measurements supplemented by interim rough estimation. What if the frequency and consistency of measurements could be improved to be affordable monthly, weekly, or even daily? That would facilitate true inventory management and control.
Managing by Thumb
“I’d love to take credit for coming up with this idea,” says Boardman, “but it was Knife River, an aggregates producer. They had a president for the northwest region, Brian Gray, who had the vision.“ When Boardman showed Gray URCV’s image processing, they didn’t have an iPhone app or a portal; they had only a technology that took pictures and turned them into points. Gray had the vision to say, “Do you think you can measure volumes with a cell phone, just from a cell phone?” Boardman asked why that would be important to his company, and Gray laid out the problem.
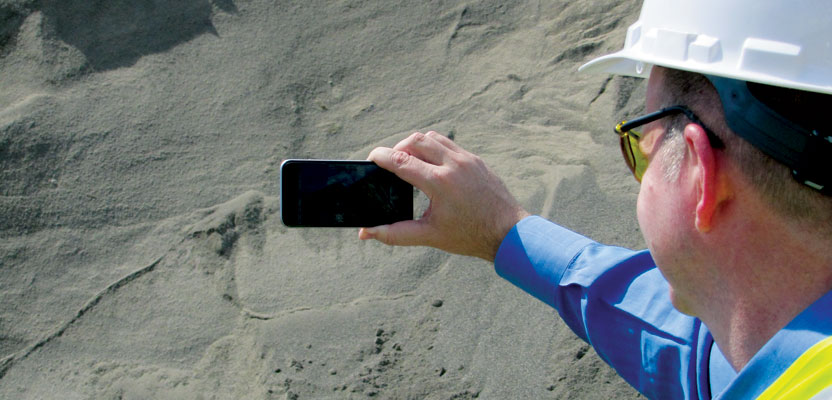
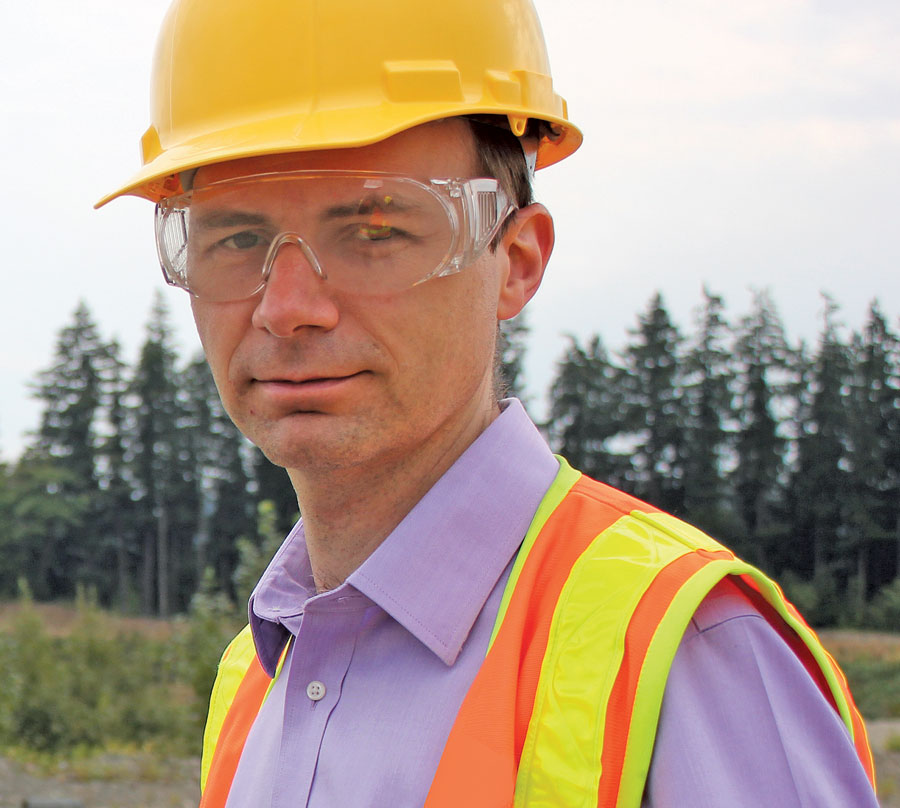
URC Ventures CEO David Boardman demonstrates a stockpile geometry capture. The ~3,000-cubic-yard pile
was imaged in ~three
minutes,
using only his iPhone and two safety cones placed 25 feet apart to establish scale.
Gray said, “We manage our business off our thumbs.” On a weekly basis their site managers are looking at piles, doing it as best they can, maybe using belt scales to track materials coming off the belts, but in reality there is a lot of “guesstimation” supplemented with occasional manual measurements.
The standard practice is to call out a measurement team or surveyors once a year, twice a year, or maybe even quarterly. The challenge is in how often can they afford to bring out the surveyors. It is not purely cost but also logistics; not many sites can afford to have a team on hand or hire an outside firm frequently. So they operate, “eyeballing” off their thumbs all year, and when they do get it measured there is a big difference.
“What do you have to do with that difference?” asks Boardman rhetorically. “You have to adjust your financials: you either have to take a write-off or have to write up.” Some of these material companies have to write off 40 to 50 to 60 million dollars on their financials. And, adds Boardman, “the C-level executives are [fed up] with it; every time it happens they look to their staff and say, come on folks, there has to be a better way!”
The vision Gray had was, if he could actually get the employees (those who were familiar with the piles, at every one of their sites) to be able to capture the piles in a manner that could be easily processed into one management system, that would be the answer for managing Knife River’s 5,000+ stockpiles across nine states.
Boardman examined the challenges of the legacy systems. “How are you going to get someone out there every month to measure those piles? You’re not going to take a hot team of experts who can use laser scanners; it would take forever and you’d spend so much money.”
A new model was taking shape. “What if we could take that front loader driver to jump off the loader, get the scale house operator to step out of the scale house, even get the quarry manager to step out?” concluded Boardman. “If it could be easy to use, and to use properly, then you’ve got a team at every single site that is familiar with the piles and can measure quickly without the bottleneck of the expert team, whether they are internal or external.” (See above.)
Boardman looks ahead. “Eventually, over the long run as these technologies become easier to use and more and more pervasive, more accepted in the industry, everyone will move to having their inventory monthly.”
The question (for a broad range of subjects) becomes, “Why change?” Sites are operated okay presently with the manual-eyeball methods—or are they? “Imagine running a grocery store with only checking what’s on your shelves once a year,” says Boardman. He notes that at stock sites, “these folks work their [rears] off in a high-risk environment, with safety issues, with low margin, with community organizations on their backs about quarries and trucks in their neighborhoods. They do this work for very little money and with very little in the way of measurement tools to help with management.”
Boardman notes that stockpile management has only recently been adopted by many companies. “Many have just now adopted logistic systems for tracking the dump trucks and cement trucks. Some are pretty good at guessing, but that is really the problem we’re solving—an inventory management problem. “
App and Portal
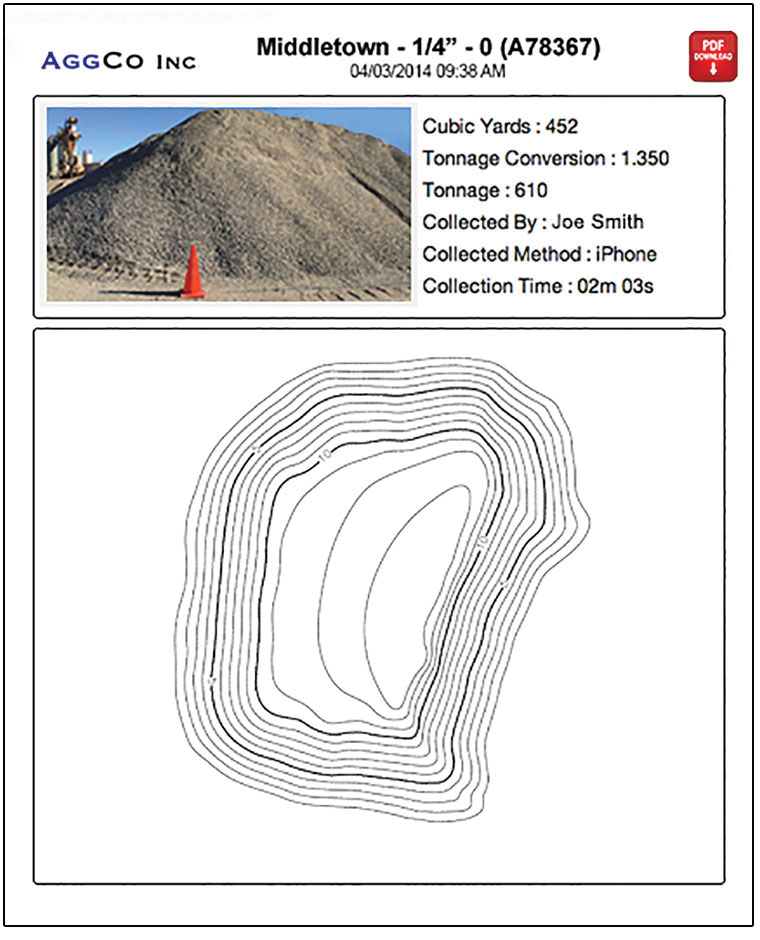
The iPhone app and portal provide a standard map view of piles at a site and a quick overview of a pile report. Full reports and a “reconstruction video”—a useful tool in evaluating pile usage and conditions—are linked.
The stockpile management portal and app are almost deceptively simple to operate and navigate. That’s by intention, as Boardman notes, “to take the pain out of managing multiple piles and sites.”
The app is available in the Apple app store; being available only for iPhone was a practical decision. The URCV tech team explained that, “an iPhone is an iPhone anywhere worldwide,” without the varied cameras and drivers that other operating systems use across multiple manufacturers. Some customers will buy a new or used iPhone as an affordable field device.
The field procedure requires only one act of direct measurement: placing two standard safety cones 25 feet apart (via measuring tape or GPS). When you start the app, an icon on the screen indicates you are gathering images, audible beeps tick away like a Geiger counter with the progress of image capture, and the app will let you know if you are moving too fast, have the sun too low to the horizon, or are over-rotated.
This is a sample report as it would be viewed on the iPhone app and on the web portal; the full report can be downloaded as a PDF.
You start at the first cone, walk past the second one, and continue all of the way around the pile until you have reacquired the first cone. Once you stop, the app plays back what Boardman likes to call a “sports highlight reel,” a replay of the circuit highlighting any problems encountered.
A standard 3,000 cubic yard pile takes about three minutes, so you can quickly reshoot if needed. And, the app was developed in the Pacific Northwest, known for mist, drizzle, and lighting challenges, so the app is optimized to be used in almost any conditions.
Once you’ve completed the process, the images are put into a sync folder. Even if you don’t have live internet access, you can sync up later or even send in files manually (sites in Australia without internet send in memory sticks by freight services).
A customer logs into the Stockpile Reports web portal with a map of all sites and all piles. As successive observations of piles are logged, you can look back at how the pile had been managed. Standard reports indicate volume and tonnage. The customer can completely manage the piles from the portal.
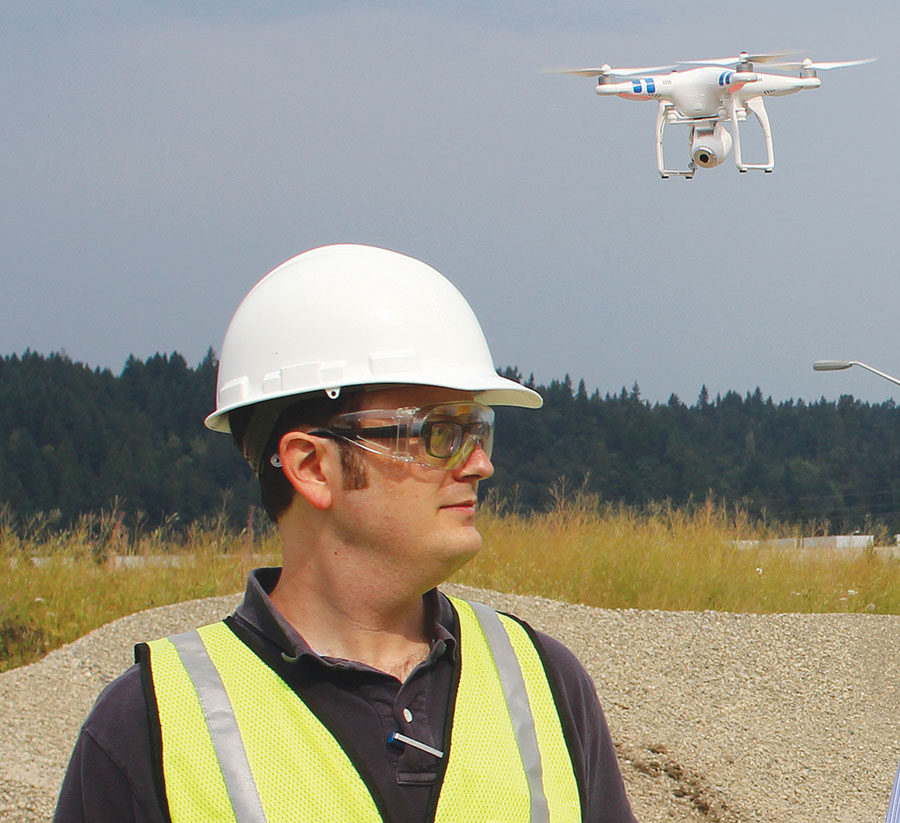
Input is not limited to the iPhone; Boardman notes that 90 to 95% of all piles are captured in that manner, but that for some piles other tools are the best option, including images from a drone or aircraft, GPS/GNSS, laser scanner, or even a walking wheel. The app will prompt someone with a walking wheel to take specific measurements on a pile, and it will process to the portal just like the other inputs.

Comparing Conventional Measurement
For those of us from a conventional, legacy measurement background considering the new wave of measurement choices, especially things 3D, image reconstruction, and cloud-based processing, it can be difficult to suspend our natural disbelief. Conventional measurement wisdom has always held that labor-intensive, expert-executed, precise-baseline measurement enables high-confidence interpolation and estimation. But as the value proposition of such methods erodes with, say, the dropping margins of bulk products (pre-engineered and automated), aggregates, and mined materials, there is a lot of pressure to find alternatives.
Some wonder if this type of end-user measurement using cloud processing services is crossing into the territory of expert measurement, but these are the same end-users who have mostly been measuring with a walking wheel, measuring tape, or simply working from their thumbs. Nothing is different except the tool.
These conversations come at the same time that neo-measurement tools—remote sensing, close-range terrestrial photogrammetry, UAS, robotics—are achieving astounding heights of reliable, rapid, and automated precision. But still, scepticism about precision is understandable. Some sceptics have, though, performed head-to-head comparisons between methods and were pleasantly surprised at the results.
The Texas Department of Transportation (TXDOT) has been working with Stockpile Reports for two years, all via iPhone. Most of the stockpiles of the TXDOT maintenance division are small, a couple of thousand cubic yards each. A lead surveyor was concerned about accuracy, and during early tests would bring along a laser scanner and GPS. After six months of measurements, they reported that the iPhone-derived volumes were coming in within about 1.6% of their conventional measurements (traditionally done only on an infrequent basis).
More important, as Boardman points out when they showed the results of the broader inventory to the executive leadership, the differences between what TXDOT had in inventory in the system, on average, was closer to 40% off because, in reality today, they are not doing all of the piles with a laser scanner and are mostly using their thumbs.
Another standard practice to determine inventory volumes is that, when material is dropped off, they are handed a ticket stating some tonnage, and when it is put into inventory a conversion factor is used. This results in an erroneous inventory baseline for any given pile. There is a massive potential for savings from a program of more frequent measurement. TXDOT’s chief strategy and innovation officer has submitted Stockpile Reports for the American Association of State Highway and Transportation Officials (AASHTO), which honors, as the application states, to “promote this technology to other states by participating on a Lead States Team supported by the AASHTO Innovation Initiative.”
The resultant business case for adopting Stockpile Reports projects around $2M savings per year—in labor costs alone. This is not taking into account inventory discrepancy. “The potential for putting that capital to other uses once they get their inventory sorted out,” said Boardman, “that is huge.”
Computer Vision(s)
We asked Boardman how URC Ventures came about and how they became involved in piles of rocks. There is a long history involving some of the brightest minds in computer vision and 3D reconstruction, a group of innovators who chose to diligently look for compelling problems and then develop solutions to solve them, quite pointedly not solutions looking for a problem.
CEO and co-founder David Boardman is an entrepreneur and tech developer with nearly two decades at managerial and executive levels for Fortune 500 companies, including Hewlett Packard. “Our investors and founders have a lot of experience in the 3D business from the military side and saw commercial applications for large-scale image processing and 3D reconstruction,” said Boardman in an interview at the URCV main offices in Redmond, Washington.
It started with that vision. The market timing was right, doing large-scale image processing and 3D construction had been proven to be viable. Boardman and his partners knew how to do it. Their deck was 3D stacked, from investors and board members on down, with people who know how to succeed in such ventures.
He notes his key technical team: “By getting Jan, Charles, and Brian on board” (see the sidebar Vision Team), “we’ve developed technology that solves different problems than that our founders had tackled for military purposes. URCV decided from day one to go after ground-based; everybody already seemed to be doing airborne [and] drones. Right after the company began development was when C3 was sold to Apple, and everybody was doing their mapping deals to figure out how to do Google Maps in 3D, how to do Apple’s Maps in 3D. Airborne was seeing more than enough development.”
Keeping Grounded
“We see the market for ground-based to be much bigger,” says Boardman. “Everybody has these [smartphones] in their pocket. Drones are wonderful […] but it may not be as big a market as ground-based, maybe not for a long time. We see the bigger market opportunity as getting people to pull [their phones] out of their pockets on a daily basis to create interesting opportunities and solutions with ground-based imagery.”
Boardman expressed pointed observations about the drone/UAS business. “When we started four years ago, we knew we were making a longer-term investment because we could have jumped in and followed the drone game. The drone game is in the hype phase.” He added, “It will follow the pattern that all new technologies do—mobile did it, WiFi did it—you go through your hype curve and then you sink into the trough of disillusionment.”
We asked how soon we might see UAS blossom. “It’s going to take five years. First you have to sink into the trough of disillusionment, and then the grounded business-driven use-cases will drive the industry.” But, he notes, “the players may be completely different.”
Stockpile Reports does offer the option of process, drone-based imagery as well as GPS, scanner, and even a walking wheel. Clients, says Boardman, “bought drones bundled with 3D software and found that they could process their own but, when confronted with doing 20 piles or more, have since turned to us to take care of that backend processing so they could concentrate on flying and become as efficient as they could at flying multiple piles and sites.”
The Vision Team
URCV’s chief scientific advisor, Dr.
Jan-Michael Frahm.A relatively small and close-knit community of researchers and developers are in the world of large-image processing and 3D reconstruction. With academic hotspots in places like Zurich and Chapel Hill, North Carolina, and commercial development hubs in Silicon Valley and Redmond, Washington, many of the top minds have been colleagues or have studied together. URCV assembled a team to deliver the magic needed to solve stockpile puzzles, but also for grand plans ahead (though they were understandably not so willing to talk about those).
URCV’s chief scientific advisor, Dr. Jan-Michael Frahm, is a professor with the University of North Carolina, Chapel Hill and joined the URCV team to, as he noted, “take at last our technology and research into the real world, make things work, and do meaningful things we’ve been developing for many decades in computer vision and my own research.”
Of his main areas of focus and research, Frahm said, “I am mainly working on real-life scale systems with thousands or millions or tens of millions of photos and building 3D models out of those. This knowledge we can apply to URC Ventures, building new ideas.”
While not revealing specifics of the back-end processing for Stockpile Reports, Frahm gave an example of just how advanced are the automated image-matching and correlation algorithms from his key role in an amazing exercise in mass-image-processing and 3D reconstruction, in the video, “Building Rome on a Cloudless Day.”
Frahm detailed some of the challenges: “Modeling for large-scale photo collections, [the Rome project was] kind of an extreme case because we have no control over the cameras, [and] many different models [were] imaged by different people. Some of the cameras store that info, but most come with no metadata at all. Comparing every image to every image … it would blow up your computer. But there are robust estimation tools I’ve been working on for many years. You still have to be very fast. We did, though, do this on a single PC.”
URCV’s program manager and senior research engineer, Dr. Brian Clipp.
Frahm was academic advisor to Brian Clipp, who graduated from UNC and worked on Defense Advanced Research Projects Agency (DARPA) projects before joining URCV about 18 months ago. While at UNC, Brian researched mapping using a stereo camera to walk around the interior of buildings (in closed loops). He notes that’s not particularly unique, but doing so in real-time certainly was.
His expertise in real-time image processing was further enhanced while working on a DARPA project focused on augmented reality for joint terminal air controllers. Clipp explains, “These soldiers call in air strikes for special forces and forward to air controllers on the ground, trying not to be detected and shot—a very information-intense job.”
The system is a see-through display on their helmet with graphics projected on to it, updating as the head moves around with a minimum of latency. Clipp said, “The display helps you know where the friendlies are on the ground, where the aircraft are in the sky, where the potential [enemies that you’ve designated] are around you. Keeping that all straight is very difficult.
“I worked on the pose estimation for head positon.” He adds, “ Introducing even a small amount of latency, even 15 milliseconds —a person can detect that. It starts to look like swimming—icons moving off what they are supposed to be over. It can make people sick who wear it or make the info coming off it not very useful.”
Before joining URCV, Clipp developed a real-time visual localization and mapping algorithm used in Honda’s famed Asimo Robot. Clipp is URCV’s program manager and senior research engineer.
Dr. Charles Erignac, senior research engineer at URCV.
Fellow senior research engineer Charles Erignac earned his Ph.D. in computer graphics from the University of Pennsylvania’s Center for Human Simulation.
Prior to joining URCV about 2.5 years ago, Erignac spent 11 years at Boeing working on various imaging tools and visualization applications as well as robotics. In addition to back-end image processing development, different types of point-cloud processing, image manipulation, and cone detection, Erignac works on end-user tools and visualizations
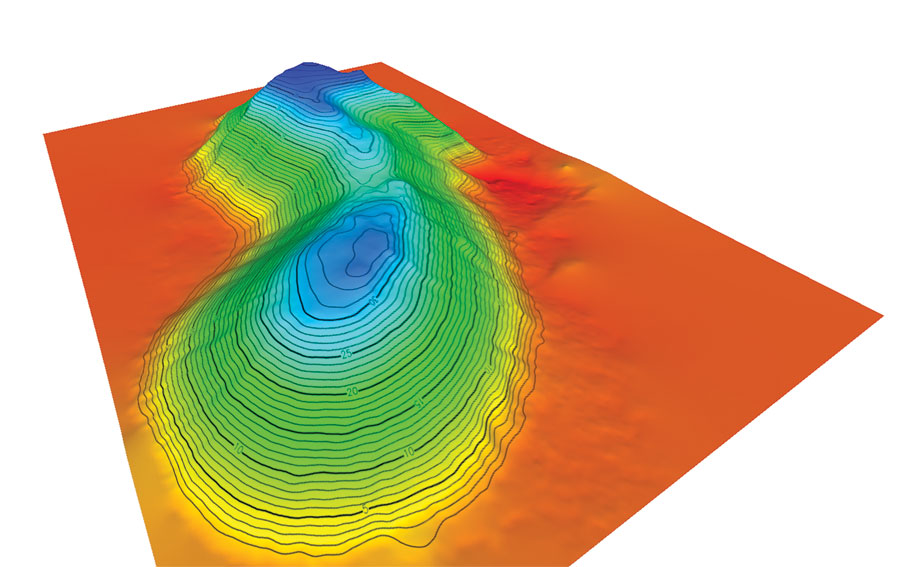
He explained that the “user gets a visualization in the form of a topo map [of each pile], but we can also produce various surface model point clouds. From the aerial image sets […] we can also produce an ortho of site.”
I asked if there was any advantage to the user of a UAS to submit oblique images. Erignac replied, “for the processing of [standard] piles, no, the vertical images are the best.” For this type of automated processing, Erignac explains that, “if there are concave surfaces or [inward facing angles], the processing for images other than vertical can be difficult to do with a drone unless you have a gimbal [for the camera].“
Erignac says that many of the autopilot and camera control programs for drones may not be optimal for collecting images for complex features, but he has seen interesting programs from providers like 3D Robotics.

Just the Answers
URCV did not get started with the intention of making an app for stockpiles, and they view this as only the first of such ventures: one that is generating appreciable revenue that can be invested into further R&D and market development.”
We spent a long time picking the first one,“ said Boardman. “What we were looking for was something that was ground-based, an activity that needed to be done fairly frequently, not something that is done once a year, something daily or weekly. And we were looking for C-level problems that are industry wide. We talked to healthcare, entertainment, construction, then mining and aggregates.”
The types of customers currently served include aggregates firms (some with thousands of stockpiles internationally), construction firms, and mines. Boardman sees new services arising from those markets and beyond. “A mining or large construction operation could be creating millions of images per day. We’re going to be processing imagery from hardhats, from fixed cameras, from cameras mounted on equipment to mobile phones—crunching all of that imagery and pushing out answers.”
Yes, everyone sees the technology and thinks, “Wow it’s a fast way to measure piles!” but, as Boardman emphasizes, “The reason we created a faster way to measure the pile is to help an enterprise that has hundreds of sites get a handle on their inventory through a single portal and do it in a cost-effective way.”
I asked Boardman if he felt that his business fell into the category of software-as-a-service. He responded, “I like to think of us as being in the business of answers-as-a-service.”