Maximizing the data collected from airborne lidar helps protect historic structures in older cities

Dr. Debra Laefer
In Part I last month, we outlined the research performed in Dublin, Ireland, and Brooklyn, N.Y., using hyperspectral scanning to help old cities protect historically significant buildings during new construction projects. In Part II, NYU professor, Dr. Debra Laefer, explains how teams maximized the value of their lidar and hyperspectral data and her biggest takeaways.
In addition to the use of hyperspectral information for historic building preservation during construction, these types of base maps can be used for many other purposes during construction or for further research, such as modeling sun/shadows, urban wind patterns, and disaster-response planning. The data is a useful tool for public meetings and project websites, helping the community understand the projects being planned. In the following interview, Laefer outlines the biggest takeaways from her research in the two cities.
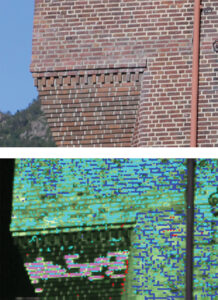
Material identification is possible with the hyperspectral imagery by analyzing the molecular response spectrum. Image by Zohreh Zahiri, PhD
Your research in Sunset Park proved that you can get much more data on the vertical surfaces and facades of the buildings by creating an optimal flight pattern of 45 degrees instead of the parallel flights. How did you arrive at this conclusion and are there any additional costs or other challenges with this strategy?
The data we get on the nadir view is largely the same no matter the flight pattern—parallel to the city streets or at any angle. We wanted to show clearly that the facade captures were much better when we flew at a 45-degree (to the streets) flight pattern. Based on our work in Dublin we knew this would be the case. The Sunrise Park flights will allow us to quantify the difference definitively. As to the cost, the total scanning time was only four hours to conduct the entire experiment, so the general flight time costs of each method were the same. The only increase in time and money was that it took a little more office time for us, together with Tuck Mapping Solutions, to do the flight planning and map out the optimal pattern. Our work differs from typical commercial practice because of the extra overlap, but that cost is fairly negligible in the overall cost as it is only a relatively small increase in the flying time—about 12 percent.
You chose to scan Sunset Park with a helicopter mounted sensor rig. This was a fairly small area (approximately 1 square kilometer), so why did you choose this type of airborne scanner rather than a terrestrial laser scanner?
Anything that is ground-based would not only take a lot longer, but it would not be able to capture critical urban features, such as roofs, balconies, and cornices, as well as all of the things that would be hidden from street view, such as the backyards and alleyways, which are critical to building a full 3D urban model.
While documenting street-level and vertical features is more difficult from the air, we felt that the state-of-the-art equipment we were using combined with our geometrically optimized flight path would meet the challenge. So for our purposes, a helicopter mounted RIEGL scanner was the clear best choice.
Your researchers conducted a lot of other experiments during the aerial data capture. Can you give us a few examples?
We conducted about 300 experiments.Most of them were related to creating a library of hyperspectral signatures with which we intend to build a reference library that the geomatics community can use to quickly identify materials in the built environment. This included concrete, brick, wood, sheet rock, and a wide range of metals and plastics. We also wanted to see the precision of the aerial system, which we could check against the geometry of the items we set out. Finally, we want to look at dynamic events: items moving through the study area while the helicopter was flying.
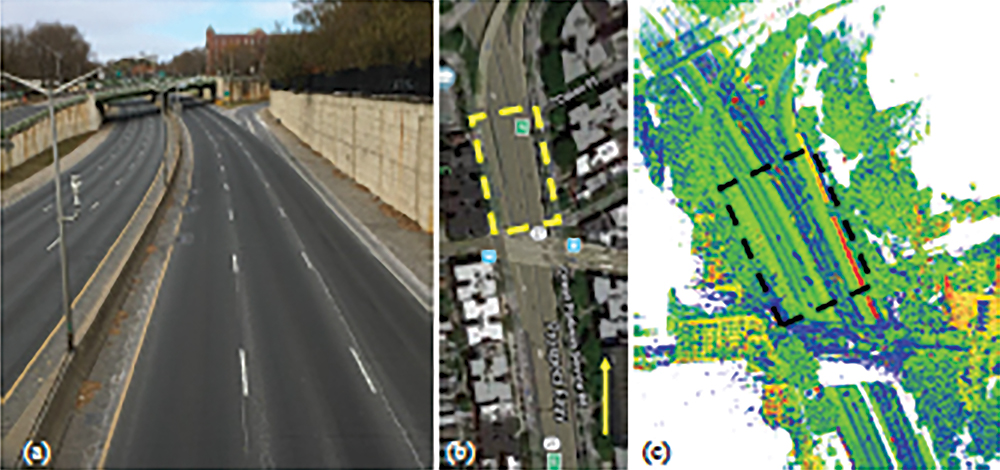
(a) Photograph of the scanned highway section. (b) Map view of the highway section: the yellow arrow indicates north. (c) Overview of point cloud data showing the highway section with the surrounding vegetation, buildings, and overpass. Color represents the material reflectance. The dashed boxes in (b) and (c) indicate the secion of the highway considered for the analysis. Images courtesy of Anh-Vu Vo, PhD
When we had notice from Bobby (Tuck) that the helicopter was en route, the students began setting out small mechanized experiments and we began walking through the project area doing “normal” urban things: wheeling a suitcase, talking on a phone, etc. We also set out tubs of water with different levels and types of pollutants. This would enable us to see how good the hyperspectral imagery in conjunction with the lidar was for water-based pollution detection.
Knowing a building’s materials and its exact geometry are critical components to generating meaningful 3D models that can be used for the kinds of computational analysis regularly undertaken by civil, structural, and environmental engineers. These models are used for determining pedestrian wind comfort, urban heat island effect, pollution dispersion, and much more, including solar potential and right-to-light calculations.
You have said that you believe that much more can be obtained from these datasets by using the full waveform that RIEGL’s scanners provide. What makes this important when you are creating an urban base map?
When the pulse goes out it is sending bits of energy, not a bullet, but a stream of photons. Those hit a surface and they come back. Ratta tat tat…and the exact intersection with the built environment is estimated from the peak of that energy.
We believe that by working with the full waveform directly, we may be able to get more exact data especially when the pulse partially encounters two items (thereby splitting the pulse). This might be a tree branch, and part hits the ground. In that case, we usually have two identifiable peaks that can be obtained from the full waveform. But when the objects are closer together, the energy returns can overlap and the current algorithms mistake this for one object.
Not only is this important from an accuracy perspective, but on vertical surfaces where the data collection is only 10 percent of that of the horizontal, it provides the potential of harvesting more data from the sparsest part of the data set. This could greatly help further downstream processing through the capture of details that might have otherwise been lost.
How are you handling these large data sets?
We need a lot of RAM to process the data, and most standalone systems have only so much RAM. As data sets get bigger and richer, we need more capacity. At a certain point, it becomes untenable. The common solutions are to throw away data, decimate it, or chop it up. Then, you’ve lost the richness of the data or introduced spatial continuity problems.
We have looked into a lot of storage systems, and we continue to explore options. But for now, we have created our own program called Ariadne3D to store, query, and visualize our data.
We had to do something, as our super high-density data sets (>300pts/m2) no longer worked effortlessly with standalone computing. The traditional tiling approach becomes highly challenging with these denser datasets. If the data size of the tile is to remain the same, then the spatial extent must decrease. At a certain point, objects that comfortably fit into the old tile are now split among multiple denser new tiles. Each tile division introduces spatially discontinuity problems.
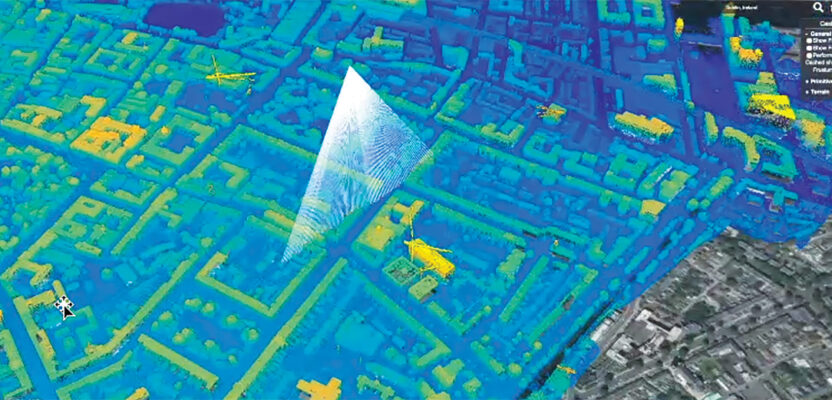
In response, we developed Ariadne3D. From day one, it was designed to take advantage of distributed computing systems and to support fully 3D, multi-temporal, multi-spatial data. The system uses parts of the open-source viewer Cesium as a front end and enables the user to visualize the data collection and the full waveform of the lidar, as well as the traditional point cloud functionalities. Having such power allows us to process directly on the data points instead of having to fit geometries and then use a less detailed model, as is common in digital terrain and digital elevation models.
Once you understand the potential value of the data, it’s then a matter of operationalizing it—finding a way to work with it while preserving the dimensionality and precision of the data and use it to perform different types of analysis or design. We are currently extending Ariadne3D for more seamless integration of imagery and hyperspectral imagery. In that case, the pixel information will be directly affiliated with the points.
You are using lidar and hyperspectral sensors in such interesting ways in urban environments. What else are you working on that requires this specialized equipment?
There are now great opportunities to collect and co-register lidar with other remote sensing data sets like thermal imaging or electromagnetic resonance. Our researchers are constantly coming up with new ways to get more out of existing technology.
Let’s say we want to know how much noise a new highway will produce. To do a really good acoustic analysis of something, you need really good geometry. Therefore, if you can take a scan and couple it with existing noise readings, you would be able to better model how that site will be influenced when you change the geometry. Basically, you have coupled the sound recordings with the lidar base map and can learn some truths, and run lots of if/then scenarios.
Similarly, with wind, if you change the geometry of a noise barrier you can then analyze the factors of potential drag (wind resistance). This could be a big issue for truck platooning or autonomous private vehicles.
If we can design a highway in a way that reduces potential for drag, or gusts of wind, it will be very helpful in terms of safety and energy usage. Basically, on top of the lidar point cloud you could layer on historic wind measurements. We have recently done an investigation of this for the Brookwood Foundation.
Lastly, thermal sensors can measure heat dissipation and can also see which parts of the building are warm and cold so proper energy efficiency improvements could be made. You could also create a 3D replica of the building and test how smoke would travel. In that way you could better design air handling systems, as well as more precise fire or other emergency evacuation plans can be created. In all of these cases, the lidar point cloud can be an effective skeleton on which to co-register and visualize all of the other data. The lidar point clouds are so wonderful as they are so complete; often much more so than some of the other data sets.
When we understand the cultural, as well as the monetary value of these old buildings, we see a real need to do a better job of protecting them.