A satellite set to launch in 2024 will scan the Earth’s surface every 12 days. What does that mean for geospatial professionals?
During the recent South Florida GIS Summit, I had the pleasure of attending a presentation by the National Aeronautics and Space Administration (NASA) that blew my mind in terms of potential for the geospatial community.
Batuhan Osmanoglu, a research scientist at the NASA Goddard Flight Center in Greenbelt, Maryland, made a stunning presentation about NISAR. Led by the Jet Propulsion Laboratory (JPL) in Pasadena, California, NISAR is a collaboration between NASA and the Indian Space Research Organization (ISRO) to launch a joint satellite mission to use synthetic aperture radar (SAR) to map the entire surface of the planet every 12 days.
The origins of the project can be found on a scientific need to observe, analyze, and store minute changes on every square meter on the surface of the Earth over a three-year period. This will provide the scientific community with a reliable record of what happened to the planet’s crust during that three-year interval.
Volcanic activity forecast, subsidence analysis, erosion, coastal degradation, rising sea levels, and many others have been suggested for the NISAR data, but geographic and cartographic applications are not out of the question for this valuable information.
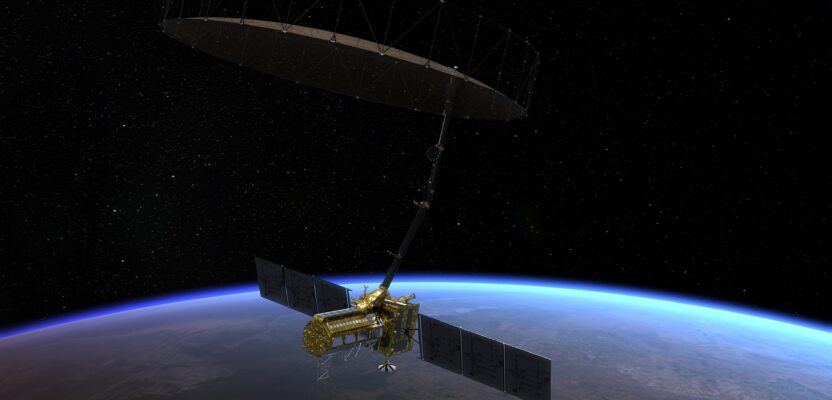
The NISAR satellite and a depiction of it in space. Credit: NASA/Caltech
In the October issue of xyHt, Marc M. Delgado, PhD, published a fascinating article about the availability of free cartographic satellite data to the geospatial community since the early 2000s. The addition of the NISAR satellite to our skies will come to enhance not only the quality but also the diversity of this information and its accessibility. The difference with existing satellites and the records they produce and NISAR is that we, as a community, still have time to introduce ideas on how this data might be used for mapping and cartography. Keep in mind that radar data is ultimately at a different wavelength (e.g., color in optical frequencies) and therefore shows different things compared to traditional scale imagery. NISAR data will be at the centimeter level, therefore will be better suited to analyze structure and less useful to analyze color.
The NISAR satellite is set to launch from the Satish Dhawan Space Center located in the barrier island of Sriharikota, India, in early 2024 and therefore there is plenty of time for geospatial professionals to find out more about the data types and to come up with innovative ways to use it for monitoring mapping.
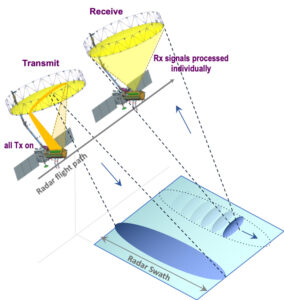
The SweepSAR technique allows full-resolution, multi-polarimetric observations across an extended swath (greater than 240 kilometers). In transmit mode, the phased-array feed is tuned to illuminate the entire swath. In receive mode, they are tuned differently, so that the return echo scattered from the ground can be localized in time and hence in space. Transmit and receive events nearly overlap in time and space but are shown separately here for clarity. Image Courtesy of NASA/JPL
SAR refers to a technique for producing fine-resolution images from a resolution-limited radar system. It requires that the radar be moving in a straight line, either on an airplane or, as in the case of NISAR, orbiting in space.
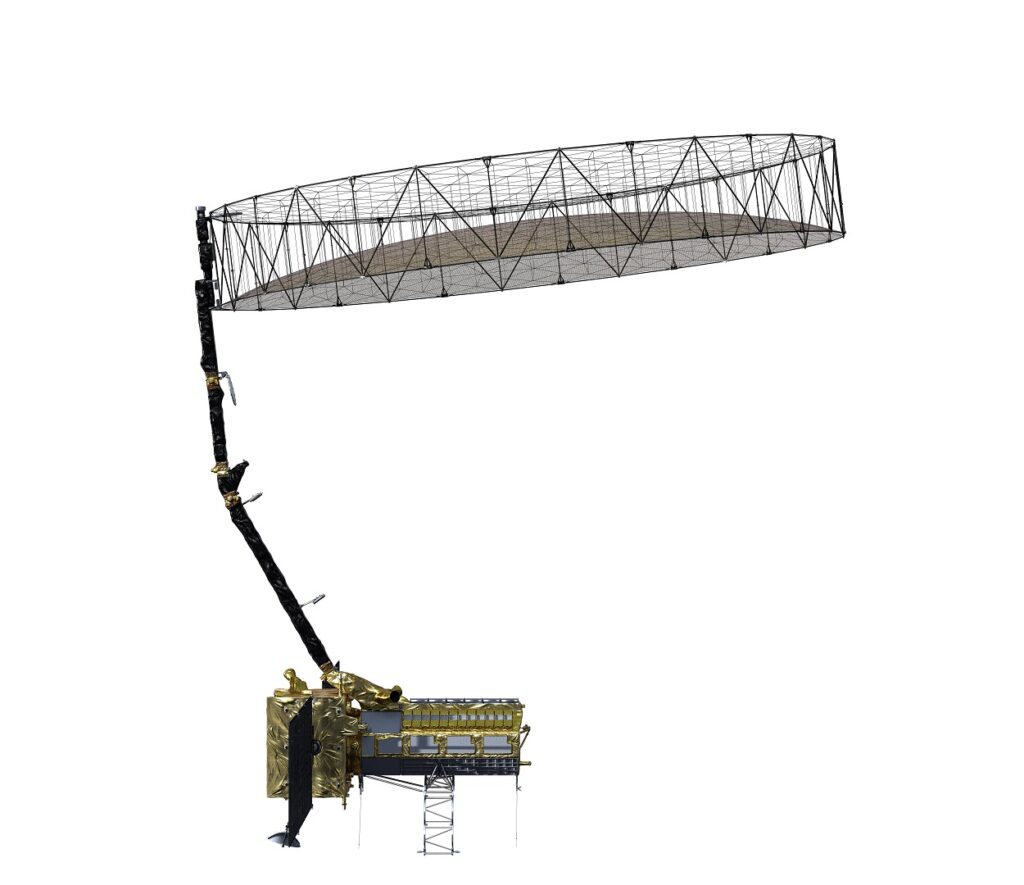
The NISAR spacecraft will have two fully capable SAR instruments: NASA’s 24-centimeter wavelength L-band Synthetic Aperture Radar (L-SAR) and a 10-centimeter wavelength S-band Synthetic Aperture Radar (S-SAR) provided by the Indian Space agency. NISAR has an approximately 240-kilometer swath, about seven-meter resolution along track and two- to eight-meter resolution cross-track (except in the Sahara Desert where it will be 30 meters).
NISAR’s unique application of SAR technology will produce extremely high-resolution images. Radar penetrates clouds and darkness, enabling NISAR to collect data day and night in any weather. The instrument’s imaging swath—the width of the strip of data collected along the length of the orbit track—is greater than 150 miles (240 kilometers), which allows it to image all the land and ice surfaces of the entire Earth in 12 days.
Over the course of multiple orbits, the radar images will allow users to track changes in croplands and hazard sites, as well as to monitor ongoing crises such as volcanic eruptions. The images will be detailed enough to show local changes and broad enough to measure regional trends. As the mission continues for three years, the data will allow for better understanding of the causes and consequences of land surface changes, enabling science and geospatial professionals to manage resources and prepare for and cope with global change.
Interpreting Radar Images
Making sense of radar images is not a straightforward process, and it requires that strict protocols be followed to turn side-looking geometry into a usable geospatial product. Here are some general rules of thumb developed by the Alaska Satellite Facility (ASF):
- Regions of calm water and other smooth surfaces appear black because the radar pulse reflects away from the spacecraft.
- Rough surfaces appear brighter, as they reflect the radar in all directions and more of the energy is scattered back to the antenna. Rough-surface backscatter shows even more brightly when it is wet.
- Any slopes lead to geometric distortions. Steeper angles lead to more extreme layover, in which the signals from the tops of mountains or other tall objects “lay over” on top of other signals, effectively creating foreshortening. Mountaintops always appear to tip toward the sensor.
- Layover is highlighted by bright pixel values. The various combinations of the polarization for the transmitted and received signals have a large impact on the backscattering of the signal. The right choice of polarization can help emphasize particular topographic features.
- Surface variations near the size of the radar’s wavelength cause strong backscattering. If the wavelength is a few centimeters long, dirt clods and leaves might backscatter brightly.
- A longer wavelength would be more likely to scatter off boulders than dirt clods, or tree trunks rather than leaves.
- Wind-roughened water can backscatter brightly when the resulting waves are close in size to the incident radar’s wavelength.
- Hills and other large-scale surface variations tend to appear bright on one side and dim on the other. (The side that appears bright was facing the SAR.)
- Due to the reflectivity and angular structure of buildings, bridges, and other human-made objects, these targets tend to behave as corner reflectors, which are used for calibrating NISAR instruments (see photo) and show up as bright spots in a SAR image. A particularly strong response—for example from a corner reflector or ASF’s receiving antenna—can look like a bright cross in a processed SAR image.
SweepSAR
NISAR’s large deployable antenna will be used in a unique operating mode known as SweepSAR to provide wide-area coverage and fine spatial resolution at the same time. When it transmits microwaves, the radar’s signal feed is stationary, producing a wide beam of microwave energy. But when it receives the returning signal echoes, the radar feed sweeps a narrow beam across the antenna’s reflector, thus giving SweepSAR its name.
NISAR Products
All NISAR science data, L-band and S-band, will be freely available and open to the public, consistent with the long-standing NASA Earth Science open data policy. NASA has chosen the Alaska Satellite Facility Distributed Active Archive Center (DAAC) to host the mission’s data and products.
It is said that the NISAR sensors will generate about 70 TB (one TB is equal to one million million bytes or 1012) of data products a day, so the requirements for storage will be enormous and the computing power to analyze and make sense of it equally challenging.
So, the big question is what do we do with this data? That’s the question that NASA is also trying to answer, and for that it organized and held in both 2014 and 2015 NISAR Applications Workshops. These workshops included the broad NISAR user community at the time. The workshop reports contain detailed information about the highest value applications for specific communities and the acquisition modes and processing latency required for NISAR data in that focus area.
Other workshops that focused on different scientific challenges included:
- 2017: Oceans: Sea Ice Critical Infrastructure
- 2018: Forest and Disturbance Agriculture and Ecosystems Wetlands and SAR Literacy
- 2019: USFS-NASA (organized by USFS/NASA AS/DP); Geohazards: Landslides; Geohazards: Volcanos
- 2020: Geohazards: Earthquakes & Induced Seismicity
- 2022: Subsidence & Resource Extraction
Future workshops might include Flood & Severe Weather (2023), Environmental Justice (2023), Disaster Response and Data Product Tutorial (2023).
Because the satellite has not been launched yet, NASA and the JPL are still looking to expand the user-base for the data and perhaps hear new and innovative ways to use it. For that they have launched an initiative called Early Adopters.
The Early Adopters’ Initiative
There is still time to become an early adopter of NISAR data and, therefore, the entire geospatial community is welcome to carefully study the NISAR documentation and apply to become part of this elite group of professionals. NASA firmly believes that Early Adopters provide important feedback to the NISAR team regarding which NISAR data products meet the needs of their applications and therefore defines them as individuals and organizations who have a clearly defined need for NISAR data, have an existing application that can benefit from NISAR, and are capable of applying their own resources to demonstrate the utility of NISAR data for their application.
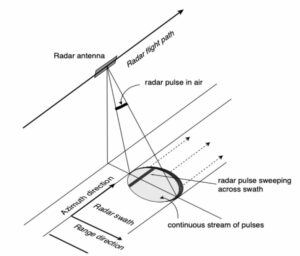
Configuration of a radar in motion to enable synthetic aperture radar imaging. Image courtesy of NASA/JPL-Caltechn
The benefits of joining include being a member of the Community of Practice, invitations to events to learn about the mission and the data, and the ability to showcase your work on the NISAR website.
Members also get access to private early adopters’ channel on NISAR Applications Slack Workspace, can join moderated EAs-Only discussions via Slack, and join quarterly EA telecons where you can present your work, receive feedback, and discover opportunities for collaboration.
Geospatial professionals interested in applying to the Early Adopters’ initiative can go to www.nisar.jpl.nasa.gov where they will be asked to provide a description of their interest (less than 600 words) including goals, region, timeline, end-users, or impact; which NISAR-like data you will be using for your tests; and how the NISAR data will benefit your application.
Even though NISAR is not necessarily a cartographic product per se, the fact that geospatial professionals will have access to a three-year period of data of the entire surface of the planet is very relevant in a world constantly shifting due to climate change and other factors. It is important for the mapping community to know about this new technology and apply to be an early adopter so we can explore what can be done with this imagery to improve current products and add this SAR information to our mapping arsenal.