Part 1: Uncharted Depths
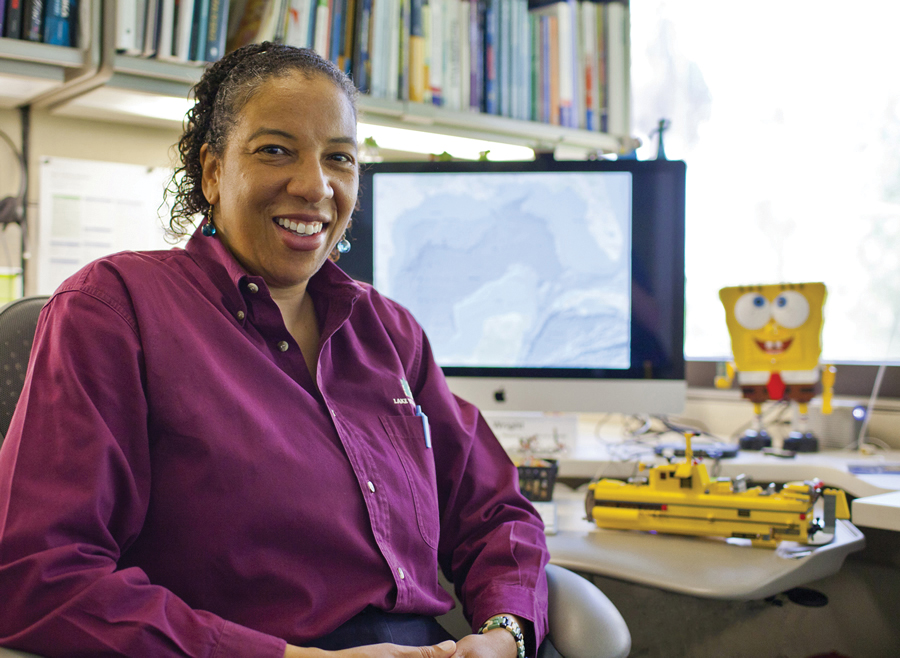
Editor’s Note: xyHt is honored to feature two distinguished scientists in the fields of hydrography, marine surveying, and oceanography: Dr. Dawn Wright and Captain (ret.) Rafael Ponce. We recently talked with Rafael and Dawn about many elements of the booming marine/hydro surveying and exploration fields. The responses contained so much depth (pardon the pun) that we are serializing their insights in subsequent issues of xyHt as well as posting online the recorded interview, full text, and many resources they have provided.Dawn Wright
The level of appreciable detail is key here. I often use the analogy that only 5 to 10% of the oceans have been mapped at the level of detail of a typical hiking map that you might take with you into a state or national park. Understanding the difference in the level of detail of maps available for the oceans as opposed to land is very important.
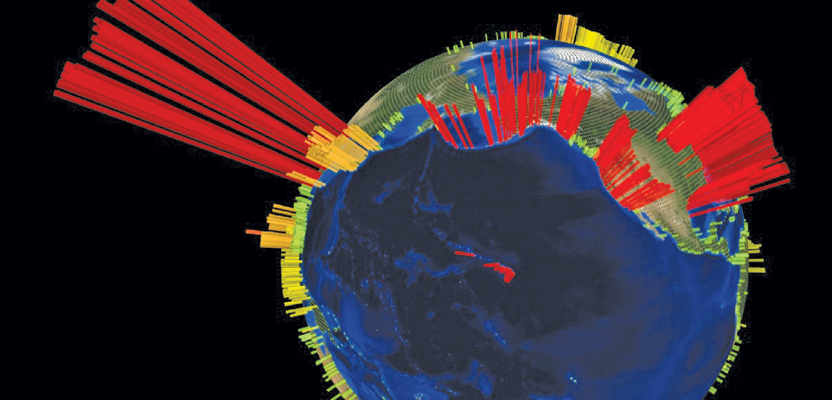
We do have low-resolution maps of the global ocean floor that come from satellites [that are] often traveling between 10,000 to 15,000 miles per hour, circling the Earth two, even three times a day. But the depths that we derive from this are approximations based on bumps in the ocean’s surface waters that reflect the Earth’s gravitational changes—that is, where the largest mountains and trenches are. As amazing as these satellite sensors are, they cannot see all the way through the water in most areas of the oceans.
So, we still need to go to sea, using acoustics (aka echo-sounding) from ships and vehicles in order to map at the finest levels of detail. The problem is that we don’t have enough systematic surveys of the ocean with these ships and vehicles to reach the level of detail and knowledge equivalent to what we have on land.
A 2001 paper by Carron et al. estimated that we could achieve a detailed map of the oceans at depths deeper than 500m (i.e., deeper than most continental shelves) with a total survey effort of 200 ship-years of vessel activity—at a total cost of less than one typical planetary exploration mission. But we don’t yet have the political will for such an undertaking, and in the most remote portions of the ocean, such as where the search for the missing Malaysia Air flight MH 370 is still ongoing, what little soundings exist from surveys done at sea must still be interpolated by satellite altimetry.
The result is a knowledge of the seafloor in that area that is 15 times worse in the horizontal and 250 times worse in the vertical than our existing maps of the topography of Mars (Smith and Sandwell, 2004)!
I have been talking mainly about the seafloor here, but the problem is further compounded when considering how little we have been able to map the water column between the seafloor and the sea surface.
Rafael Ponce

As a hydrographer and professional mariner I can tell you that the old saying—that we know more from the surfaces of Mars and the Moon than from our oceans’ bottom—is true. Just a few days ago I read about four new volcanoes found 250Km off the Sydney coast in Australia, the largest being 700m tall and the four extending 20Km long. These are enormous underwater features that have never been charted before, found accidentally by marine biologists!
This is just an example that gives us an idea of how little we really know about the seabed morphology and what’s going on below the surface, not to mention about habitats, resources, and other, more specific things. The International Hydrographic Organization considers that we have around 10% of the seafloor properly surveyed and charted.
The reason why we have maps displaying the complete ocean floor, such as the Esri’s Ocean Basemap and the GEBCO’s world bathymetry is due to relatively old, indirect-derived methods such as “bathymetry from space,” using satellite altimetry, combining high-resolution marine gravity information with available depth soundings from which scientists used to deduct the seabed morphology with a resolution from 1 to 12Km.
Today we have new methods based on multispectral Ikonos WorldView-2 satellite images and powerful algorithms to obtain satellite derived bathymetry (SDB) more accurately. But the main limitation is the depth, since this new methodology takes the relative attenuation of coastal, blue, green, and yellow spectral radiance as a function of depth. In this way you can get vertical accuracies of about 2m and about 25m horizontally, much better than satellite altimetry, but limited by depth.
Esri has an excellent business partner in this field called EOMAP; they produce SDB products with special resolution that goes from 0.3m to 30m up to 35m deep, with typical vertical accuracies of 0.5m (www.eomap.com/services/bathymetry/). We also have lidar bathymetry that can survey large, shallow areas more accurately than SDB, but depth and water clarity still are limiting factors.
At the end of the day, we need acoustic bathymetry to reach the deepest depths of our oceans, from the surface with hydrographic survey ships and closer to the bottom using AUVs, UUVs, and ROVs to get better accuracy and resolution. [This would be] a titanic effort that would take hundreds of years and a tremendous amount of resources if, theoretically, we could survey the entire planet.
I like to say that we hydrographers have a secure job for the next millennia.
Here’s part 2 of this interview.
References: