Inventory of roadway and airfield assets, including pavement surfaces, using the “One Vehicle” collection approach.
 Dallas Fort Worth International Airport (DFWIA) is the second-largest airport by land mass (27 square miles) in the United States and the third-busiest airport in the world by aircraft movement.It can easily be considered a city of its own. With more than three-million unique visitors each month and approximately 1,850 flights daily, it faces unique challenges inventorying and maintaining its vast assets while conforming to all federal rules and regulations.
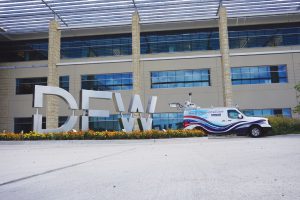
Our partnership with DFWIA arose when the Federal Aviation Administration (FAA) requested an independent Pavement Condition Index (PCI) study of runway 17C-35C. Because there is very little downtime to perform data collection around the bustling terminals and active runway surfaces, our firm, Michael Baker International, was engaged to perform asset inventory of roadway and airfield assets, including pavement surfaces, using the “One Vehicle” collection approach. We’re an engineering and consulting firm that’s been in business since 1946.
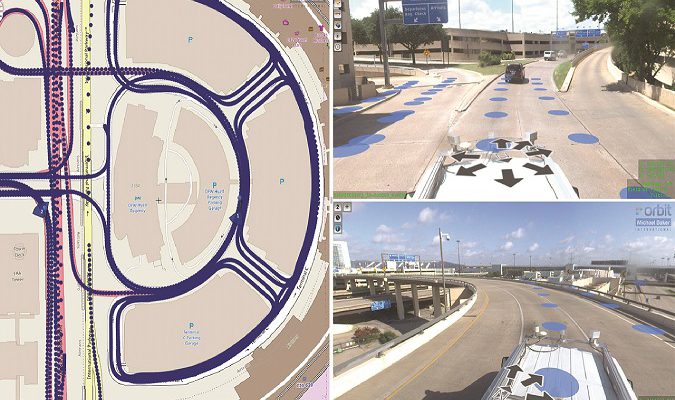
DFWIA Infrastructure and Development Division also requested condition assessment of the central terminal area roadway network—on five terminals and 120 lane miles of roadway. We chose to use: mobile lidar; laser crack measurement systems (LCMS), a single-pass, 3D sensor for pavement inspections that uses laser-line projectors, high-speed cameras, and advanced optics; and PCI visual inspections of two 13,401-foot-long runways, 17C/35C and 17R/35L.
Pleased with the work conducted under the first task order, the airport granted Michael Baker a second contract extension involving expanding the scope of PCI, mobile lidar, and LCMS to the entire airfield to include the majority of the taxiways, high-speed exits, and the hold pads.
This extension also included a subsurface condition investigation that was conducted on runway 17C/35C using ground penetrating radar and soil testing of the runway subgrade.
All with One Vehicle
Using our One-Vehicle solution, Michael Baker collected data along all roadways comprising DFW’s landside area and 95% of all airfield surfaces, including runways, taxiways, airfield roads, and aprons. In all, more than 1,300 linear miles of data were captured on DFW grounds, sometimes requiring around-the-clock collection and multiple crews to maintain the schedule without impacting airfield operations.
The collection system included sensors that blanket a 235-meter-wide collection swath with up to 1.2 million laser shots per second, each to survey-grade accuracy. The system also includes four 5-megapixel digital cameras and a 360° spherical camera for capturing high-resolution digital images suitable for attributing features and QA validations. While nighttime operations limited the use of cameras on airfield surfaces and some terminal areas, a few recollections during daylight hours to capture photography along a single path provided an effective means of gathering photography and minimally impacting operations.
Although the capture of mobile lidar over the airport would be a challenge alone, Michael Baker also captured pavement data simultaneously with LCMS, for automatically capturing and detecting many pavement deteriorations.
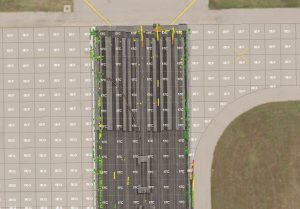
Unlike mobile lidar, the LCMS has a focused field of view immediately behind the vehicle and at a width of only 14’. Given the requirement for near 100% coverage on airfield surfaces for identification of pavement distresses, numerous passes would be required to adequately cover the 130,994 individual pavement slabs—each requiring their own attribution and categorization. The field collection crews employed real-time vehicle positioning to align each parallel pass along the runway, each pass being approximately 12’ apart to ensure adequate overlap.
Processing Disparate Data
Following collection, Michael Baker processed LAS data and imagery, minimally constraining the data for subsequent post-processing. The method of minimally constraining the lidar—performing relative adjustment of the lidar data absent ground control targets—provided the airport with a cost-effective and timely solution over setting and observing hundreds of targets.
While the data doesn’t achieve absolute “design quality,” the addition of control points on specific project locations has been performed to support the work of other design firms on multiple occasions. By employing local control points on a case-by-case basis, we were able to reduce the upfront costs while providing a mechanism to improve the accuracy of the collected data for a design project.
The airport had very specific needs related to the maintenance of their transportation assets, and GIS provided the mechanism to address those needs. For instance, questions related to the location, type, frequency, and quantity of features are answered with complete and current information. These answers provide the airport with necessary information for capital improvement budgets and proposal documentation for transportation maintenance and construction activities.
Using the newly acquired mobile lidar, ground-based photography, traditional surveying, static scanning, and legacy GIS data, our lidar technicians performed feature extraction and populated the GIS database with required features and attributes. The landside features included road pavement markings, symbols and text, road signs, guardrails, attenuators, curbing, edge of pavement, edge of shoulder, curb inlets, and catch basins. Each feature contained attributes defined by the data model.
These attributes and the domains were specific to DFWIA nomenclature or used Texas Department of Transportation class libraries for features. With having clearly defined reporting requirements by DFWIA staff, our team was able to capture all necessary elements.
Furthermore, the airside features captured included airfield roads, edge of pavement, surface designation, lighting, and paint markings. These features were populated in the geodatabase using the FAA guidance for airport GIS per Aviation Circular 17C.
Using our custom applications, we created images of each sign from the panoramic imagery captured from the spherical cameras. The images were hyperlinked to the GIS point feature in the geodatabase to provide a mechanism for airport staff to inspect the signs and determine replacement requirements.
All panoramic imagery and GIS data is being served by Michael Baker through our hosted web-services as well as ArcGIS online (see the final section) to provide all stakeholders ready access to the information.
Given the extent of data collected, add-on processing services were initiated to further exploit the highly-detailed mobile lidar data to develop a comprehensive asset management system for the airport.
Use of mobile lidar allowed the airport to incorporate a safer assessment process and to create an inventory of the airport’s ancillary assets that could be integrated into the airport’s existing GIS framework. It also enabled the airport to survey the airfield with significantly less disruption and impact on daily operations than with a traditional survey.
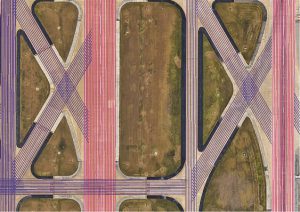
Laser crack measurement systems “collection swaths” at DFWIA.
Over the pavement surfaces, Michael Baker identified more than seven-million individual cracks.
Pavement Inspection
Typically, pavement inspection is performed manually with dozens of boots on the ground. While the manual inspection approach was also performed, the airport wanted to leverage the LCMS to examine the non-traditional method for inspecting the nearly 56 million square feet of pavement areas.
As such, Michael Baker developed a post-processing workflow to classify, quantify, define severity, and align the detailed pavement distress information with the airport pavement sections and slabs. These steps involved the development of several custom software tools and required trained staff to examine the LCMS imagery.
Over the pavement surfaces, Michael Baker identified more than seven-million individual cracks. Using geospatial queries, the cracking was aligned with the pavement slabs to provide details for each unique feature. These cracks and other deteriorations were used to model a quality value for each slab to delineate the highest concentrations of defects. Furthermore, the LCMS imagery was georeferenced using the mobile lidar trajectory data to overlay with the pavement distresses.
The incorporation of LCMS at the airport’s airfield surfaces and central terminal areas will enable the airport to more efficiently manage its pavement assets. It also provided vital information that benefits maintenance and future expansion and replacement programs—providing an inventory of all the distresses.
Hosted Solution
Given the wealth of information developed with the GIS implementation, the primary focus was switched to the delivery of the content to non-technical users and decision makers. Due to the internal challenges with deploying ArcGIS server, maintaining licenses, general upkeep, and maintenance, we decided that a hosted solution provided the best return on investment for the airport. Therefore, we used existing ArcServer licenses at our data center to deploy an ArcGIS Online (AGO) webservice to provide the GIS features and attributes to the client. By using AGO, the airport is able to take advantage of readily available base map imagery and other content while displaying their critical infrastructure data.
The AGO interface allows for the airport to select, identify, and query features from the geodatabase as well as print maps without requiring robust desktop applications or additional licenses.
Image at top: Assessment of the central terminal area roadway included five terminals and 120 lane miles of roadway.