An interior scan of an auditorium by undergraduate students gave them a thorough lesson.
Florida Atlantic University (FAU) is the only school in the southeast that offers geomatics engineering, and the professor for the terrestrial laser scanning class, Dr. Sudhagar Nagarajan, asks a lot of his students to succeed. During this past spring semester (2018), we students had to scan something in teams and write a report.
Of the 20 students in the class, the three of us had never done any scanning work. Joel Rodrigues previously worked on photogrammentry for two years at IF Rooks & Assoc., Jermaine Hamm has been working on different civil engineering projects at Florida Atlantic University, and Tucker Hindle is doing research in geomatics applications at FAU. But no scanning.
The Auditorium
We decided to scan the Carole and Barry Kaye Performing Arts Auditorium at FAU on the Boca Raton campus, in part because it had never been scanned before. Consequently, past design-improvement efforts relied on the original plans of the building. No current measurements could be discerned from those plans, so there was great public interest to collect laser-scanned data.
Moreover, we chose this venue for its remarkable history, including artist performances and FAU graduations, which contributed to the need for current data for the building.
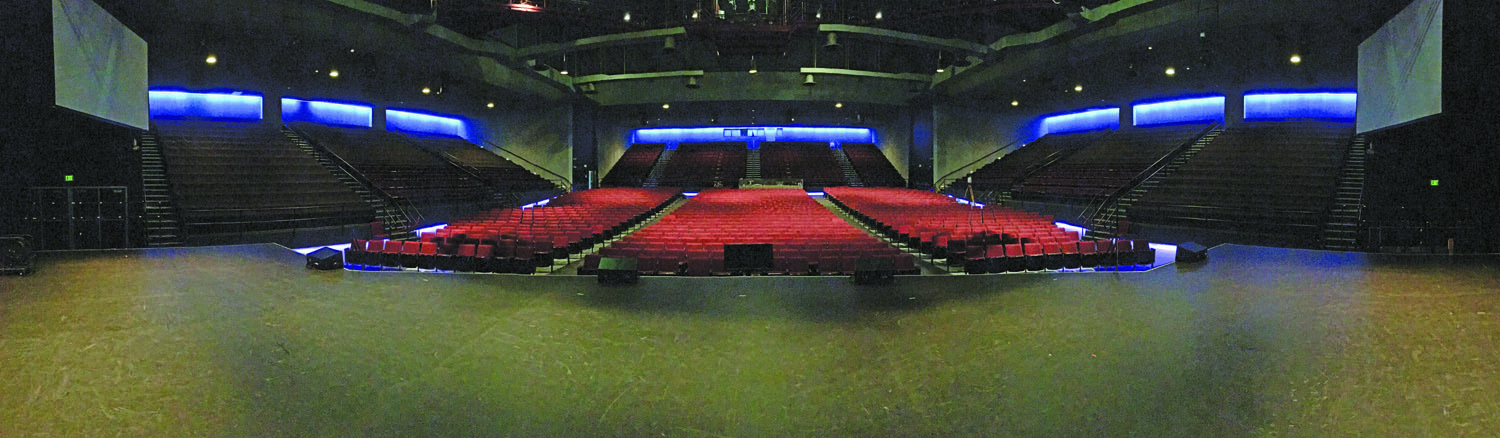
A panoramic view of the Carole and Barry Kaye Performing Arts Auditorium at FAU.
Process
The steps we followed to complete this project included survey planning, field operation, data registration, data processing, quality control, and delivery.
We examined the area prior to collecting data to plan for the number of station set-ups, locations of each station, and locations of each target. The project area was large and required multiple stations to cover the area.
We then created a plan to facilitate field operation. We chose the locations of the stations for the amount of surface area that could be collected from a single scan. Stations were placed at the middle of the stage, the west side of the building, and the back of the auditorium. We used a Leica Geosystems ScanStation 2 to scan the interior, and the point clouds created during data collection were processed and registered using Cyclone software.
Setting Up
In carrying out this project, we considered several aspects to ensure that the collected data was accurate and had little systematic error. Proper operation of the equipment was essential in minimizing these errors.
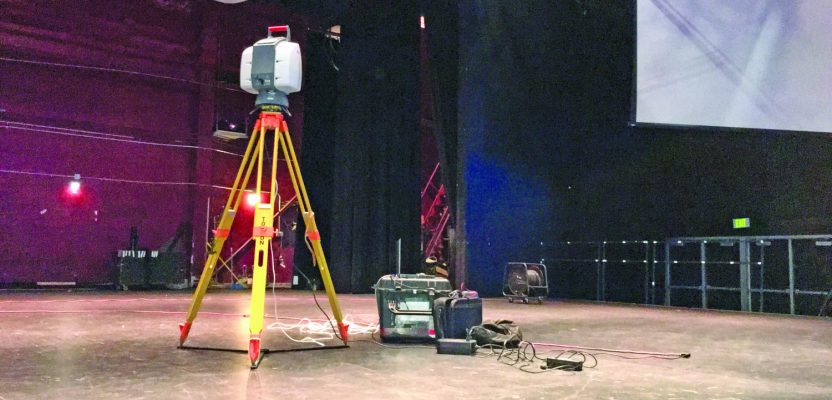
The position for station one was determined to be on the stage in the front of the auditorium. The team set up this first station with the help of a student worker. The set-up process included leveling the tripod, safely mounting the scanner on top of the tripod, and performing the final leveling of the scanner.
The ScanStation 2 was then connected to a field laptop using an ethernet cable and to a power supply using a power cord. Any unwanted movement that may have occurred during the set-up was corrected by once more leveling the scanner.
Prior to collecting data, the project database was created in Cyclone by navigating to the desired project directory and creating a new database. The database was located in an unshared server and was set as the current database.
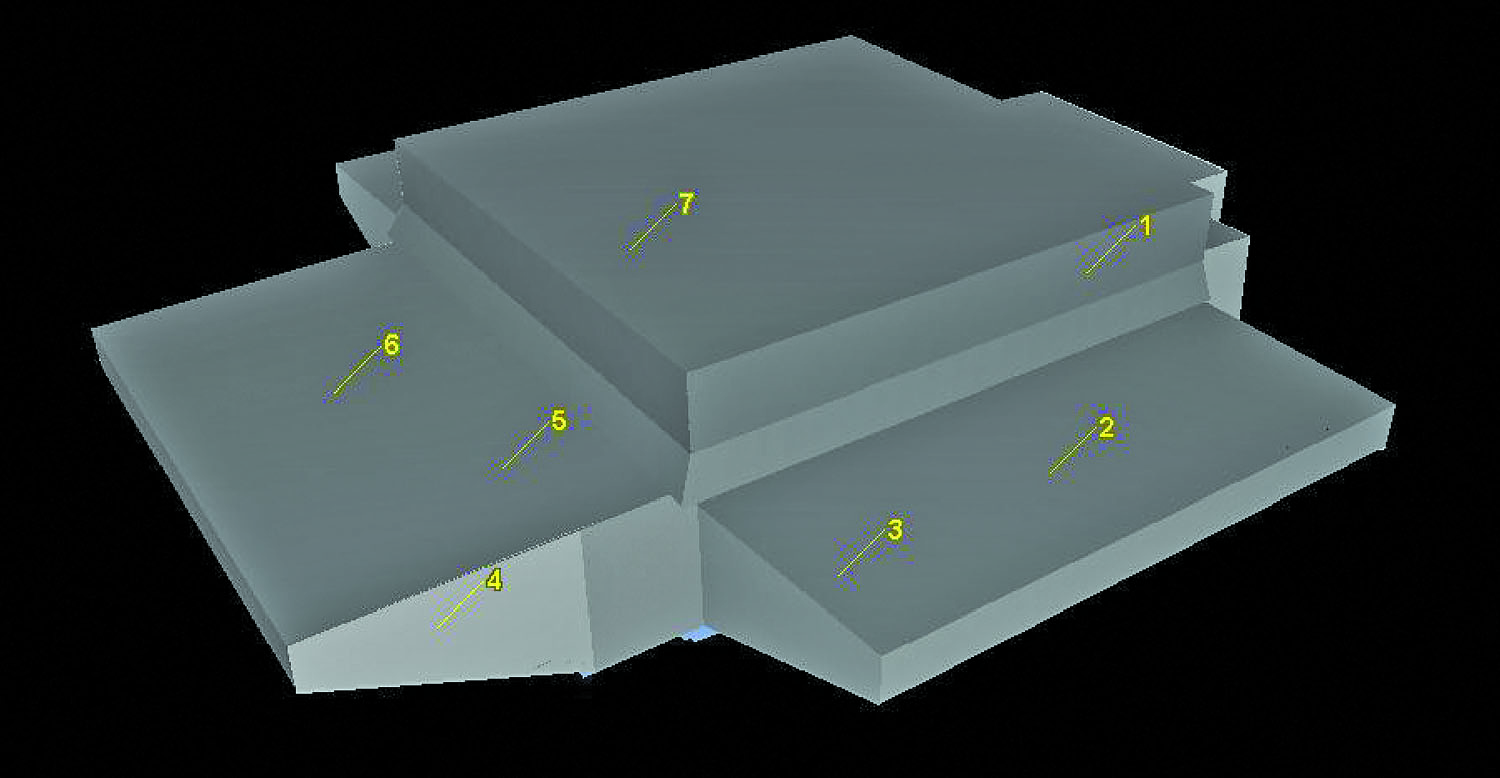
We also decided we would use an indirect registration using targets after the data-collection process, so the plan also included locations for seven targets. The targets were placed around the auditorium with positions chosen to be visible from each station set-up.
Because we moved each station after its scan to obtain complete coverage of the project area, the targets were required to align the three different point clouds created from the stations.
Data Collection
After the plan was established and the first station was set up, we were ready for data collection. The scanner displayed a green light when it was ready. We then opened Leica Cyclone Navigator on the field laptop. A connection to the scanner was established and was selected by double-clicking on FAU.
Next, we selected the recently created database. Certain parameters were defined, including the field of view, resolution, and image exposure.
The team requested additional lighting in the auditorium from the staff in the Student Union because the mere adjustment of the image exposure was not enough to collect well-lit imagery.
The station setups were moved around the auditorium counterclockwise.
The ScanStation 2 collected data at a high resolution where points represented 2 by 2 inches at a range of 120 feet. To obtain this high resolution for a field of view of 360° by 270°, each station scanned the project area for about 57 minutes. Because an event was booked in the auditorium later in the day, we had to limit how many scans we could complete.
Registration
The data collected from the three stations was downloaded to a USB and transferred to a personal computer. The team then performed the registration in the library on the same day as data collection.
Each station assigns coordinates to its collected points in its own unique arbitrary coordinate system. The stations are located at the X, Y, Z coordinates (0, 0, 0) in these systems.
The goal of the registration process was to align the three-point clouds. This was done by assigning the same coordinates to the corresponding targets that are visible in all three point clouds. The point clouds then aligned and produced a single dense point cloud using data from the three stations.
This alignment process can be done using targets, as was the case in this project. This target-to-target method is an indirect registration. The seven targets were evenly distributed throughout the auditorium in all directions to eliminate any bias in the alignment process. The X, Y, Z coordinates of each target differed in each scan, so assigning the same coordinates to the corresponding targets aligned the point clouds.
Deliverables
The final deliverables of this project provide a wealth of resources, including:
1. A database of files in either two or three dimensions that can be used for potential planning and improvement in the auditorium.
2. A useful database for reference and gathering measurements.
3. A reference to update building plans.
4. A three-dimensional model and point cloud to replace the need for measurements made using traditional surveying techniques. The operations manager has this database to refer to and will not need similar work to be conducted in the near future.
5. A model that could be used as input data in a 3D printer to build a small-scale building model. This could be used as a unique map for visitors to use to locate facilities within the building or even their seats.
6. A fly-through video to help visualize FAU’s auditorium.
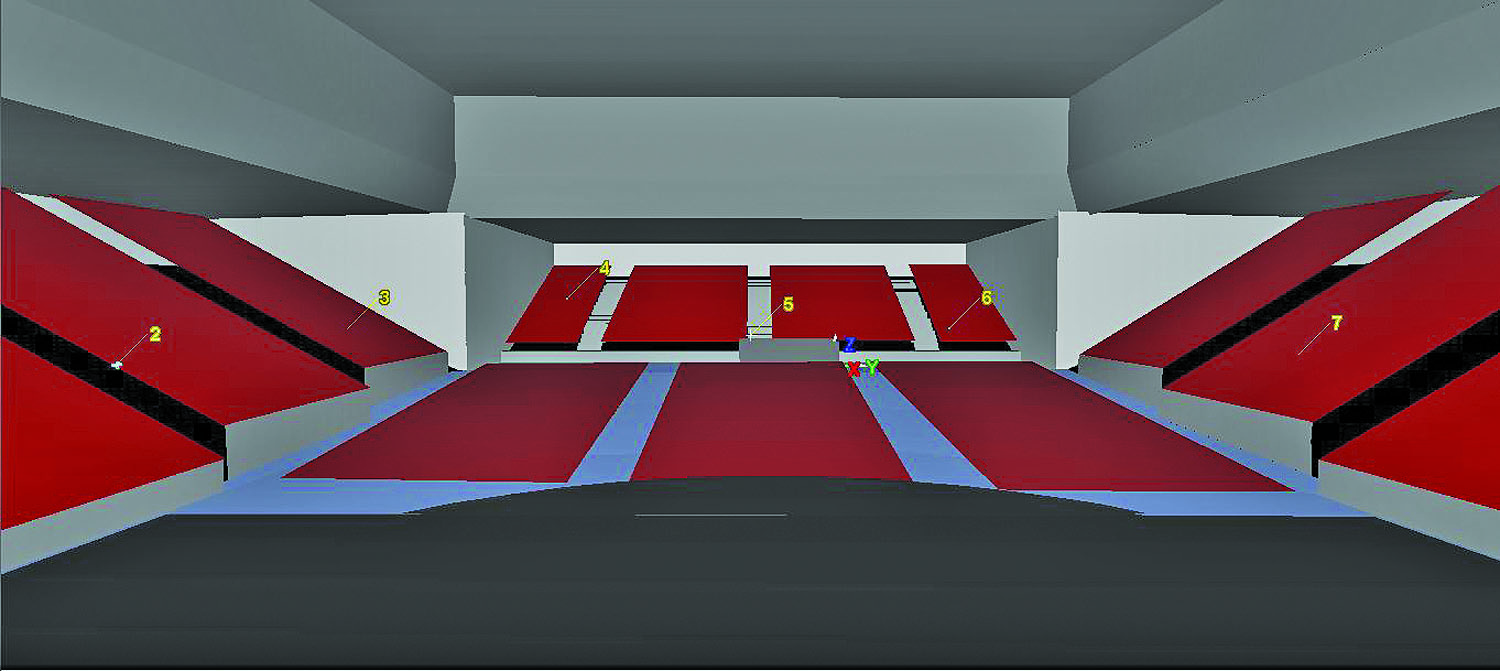
The students created this 3D model of the interior of the auditorium using Leica Cyclone software.
3D Model
A great deal of effort was spent in the modeling process to accurately represent all the features in the point cloud. A raw registered point cloud without any modeled surfaces is a large database and would be impractical for use in construction and planning.
Software such as Cyclone that can handle large point clouds is often unavailable for use in design projects. This created the need for a model of the auditorium in a more common format that can be referred to in all future applications.
The workflow that the team followed involved modeling groups of features within the point cloud and saving the modeled features within layers in the project database.
Layers were created to distinguish features sharing similar characteristics. These layers included the roof, walls, floor, stairs, seats, and miscellaneous features. Because future projects may be focused on certain aspects of the auditorium, this 3D model can be used to isolate the objects of interest. If the seats are going to be rearranged, for instance, it would be useful to separate the seats from the rest of the model by using the layer containing the seats. This allows for quick assessments of the potential space available for new seats.
The walls, floor, and roof were the most complex features to model. In part, this was because these features made up most of the building. However, it was their angled planes and intersections that made the modeling process more difficult. Planes are created to represent features such as walls, and they must connect to other planes to appear as seamless walls.
This process requires the Extend All Objects function in Leica Cyclone. Planes are extended until they intersect other planes with this function. Consequently, the entire building had to be enclosed prior to extending all the planes, which made for a model that did not appear to accurately represent the walls within the building.
Once the building was enclosed and the adjustments were made by extending the planes, the planes representing the walls aligned with the corresponding points in the point cloud.
The stage and the technical booth were represented in the same way using planar patches to represent the points captured on the objects. This auditorium contains 2,400 seats, and we decided to model the areas containing seats as planar patches.
The raw registered point cloud and the 3D model will be used by the operations manager of the auditorium this summer to provide the necessary measurements and visualization to redesign parts of the venue such as the technical booth.
Fly-through
It is important to allow a client to visualize all that’s done during a project, and an effective way to do this is to create a fly-through video of the model. A fly-through video enables the viewer to immerse themselves in the model. When viewing the model in this way, the viewer gains spatial information about the area of the building and the capacity it has for events.
Today, Jermaine Hamm has graduated with a degree in civil engineering. Joel Rodriguez and Tucker Hindle are in the geomatics engineering program at FAU and are both expected to graduate in spring 2020. They plan on continuing with a master’s degree in geomatics and GIS to advance their knowledge in geomatics applications.