Florida’s topology data gets a needed update with a massive project based on lidar data.
Three major hurricanes (Category 4 and above) passed through the Caribbean and the Gulf of Mexico during the 2017 hurricane season—Harvey, Maria, and Irma—and they were three of the five costliest hurricanes in the United States’ history. Hurricane Irma, for example, left behind more than $100 billion in damages. Most of the property damage—between $42.5 and $65 billion—resulted from excessive flooding and high winds.
Due to Florida’s flat, low-lying topography, major hurricanes can cause significant changes to the land and water flow, altering the profile of flood-prone communities and potentially creating newly vulnerable areas. As Hurricane Irma altered the landscape through most of Florida’s peninsula, Federal Emergency Management Agency (FEMA) flood models, which were based on older, less-accurate lidar data, proved inadequate to predict the extent and magnitude of flooding. New floodplain models based on new lidar data were needed.
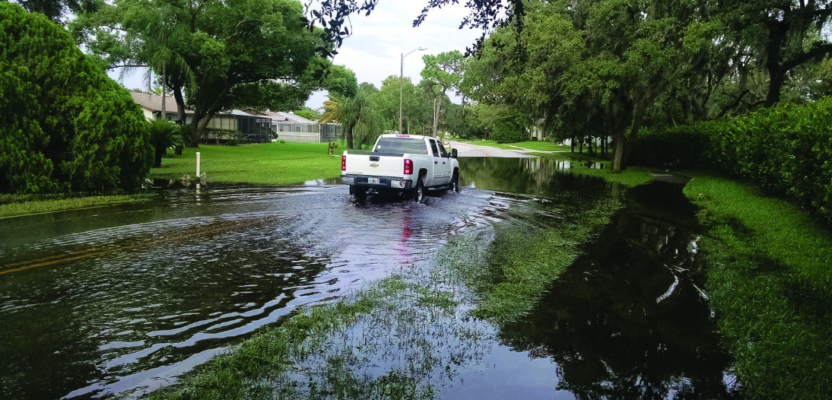
(Image above: This flooding occurred in Pasco County, Florida, in 2017 following Hurricane Irma. Credit: the Southwest Florida Water Management District.)
The Florida Peninsula Project
To update the topology data for the peninsula, an ambitious, $22 million project is underway, led by the Florida Division of Emergency Management (fDEM), the Florida Department of Transportation, the Florida Department of Environmental Protection, and the five Florida Water Management Districts, all working in cooperation with the U.S. Geological Survey (USGS).
[As several counties have been remapped since 2017 (Hillsborough, Pasco, Lee, Broward, Miami-Dade, portions of Palm Beach), those were not included in the new project. Similarly, a large portion of the Florida Everglades, including the entire Everglades National Park, was mapped in 2018 and was also not included.]
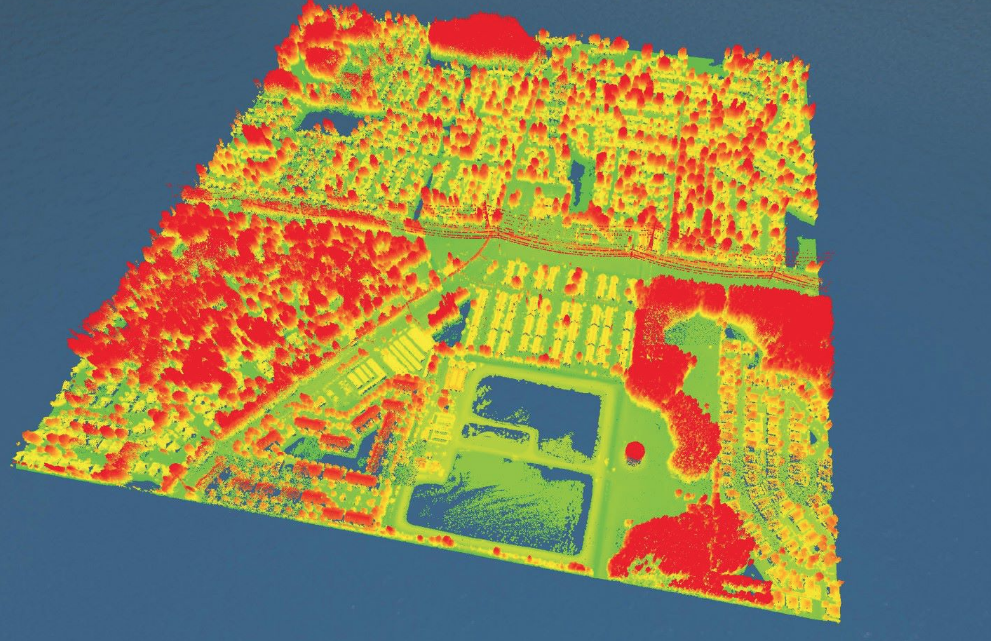
This lidar point cloud in a low-density, mixed residential/rural area shows typical, flat terrain in the peninsula (green = lower; red = higher elevations).
According to Jason Ray, GIS administrator for the Florida Division of Emergency Management, “The Florida Legislature appropriated $15 million in funds to FDEM, which entered into a joint funding agreement with USGS to match funds under the USGS Supplemental for Hurricane Irma—totaling $7.6 million—to acquire a quality level 1 specification and associated deliverables for roughly 35,000 square miles of the Florida peninsula.
“This high-quality data will be leveraged from a wide range of stakeholders through innovative tools and analyses, leading to enhanced decision-making across the state.”
Deliverables include: airborne lidar data acquisition, ground survey, and preparation of bare earth point cloud and digital elevation model (DEM) products to support:
• stormwater/surface water-hydrological & hydraulic modeling,
• FEMA Flood Zone and Digital Flood Insurance Rate Map updates, • repetitive loss modeling,
• routing for emergency evacuation and first responders for flood response, and
• recovery/resilience planning for future storm events.
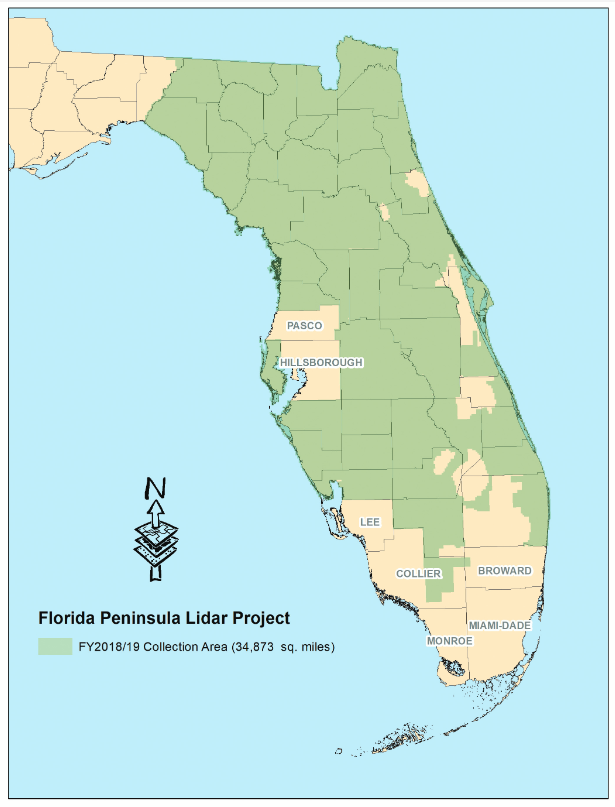
Map of the peninsula with the 34,873 square miles included in the project area in green. Tan areas were mapped recently through other projects.
Commercial Partners
The USGS and the State of Florida, procuring services through the Geospatial Products and Services Contract III (GPSC-III), selected the geospatial and mapping firm Dewberry to lead the effort as the prime contractor. Based in Fairfax, Virginia, Dewberry has 16 offices throughout Florida, with the firm’s Tampa office dedicated to geospatial and technology services.
Dewberry teamed with two mapping industry partners to assist in acquiring and processing data: Woolpert, Inc. and Quantum Spatial, Inc. Five additional firms were tasked with acquiring airborne lidar data, bringing a total of 11 aircraft to the project, each with a lidar sensor.
Sensors and Acquisition Plan
Lidar was selected as the optimum method for data collection because the technology allows for maximum penetration through vegetation to the ground surface. The point cloud lidar data will include classified ground data; building rooftops, overpasses and bridges; a hydrologically flattened digital terrain model; 3D breaklines; and associated metadata.
Contracting the project through Dewberry offered the state and the USGS an advantage in terms of sensor flexibility. “As Dewberry does not own or operate any lidar sensors, the firm is ‘sensor agnostic,’” says Amar Nayegandhi, CP, CMS, GISP, vice president for geospatial and technical services for Dewberry. “This allows us to deploy the best sensor or suite of sensors for this project.”
Dewberry chose Leica Geo- systems’ linear-mode sensors, TerrainMappers, and ALS80s, along with Riegl VQ1560 and VQ1560i sensors.
The project specifications were to meet or exceed USGS Lidar Base Specifications for Quality Level 1 Lidar (8 pulses/m2), significantly higher than is required in many states due to Florida’s flat topography. All flights were planned to reach an average aggregate nominal pulse density of 10 pulses/m2), with an average aggregate nominal pulse spacing not to exceed 0.35m.
Challenges to the Project
One program goal was to collect lidar data to construct a seamless, nearly concurrent coverage of the peninsula within a narrow flight window. The dry season, optimal for lidar data collection in Florida, starts in mid-December and extends into mid-March. Collecting the data required nearly simultaneous deployment of 11 aircraft equipped with the lidar sensors.
Unfortunately, Florida experienced abnormally high rainfall in the late summer and early fall of 2018, and northern aquifers were slow to replenish. Both factors precluded lidar collection in the Suwannee River basin, the northwestern portion of the peninsula. Those areas were deferred to the following flying season in 2019 for collection. With that, approximately 23,000 square miles of lidar data were collected during the FY2018 flight season.
In addition to the magnitude of the full project (over 34,000 square miles), the complexity of the USGS QL1 specification, and the scheduling organization required to manage 11 aircraft in the air simultaneously, there were several additional challenges to the collection.
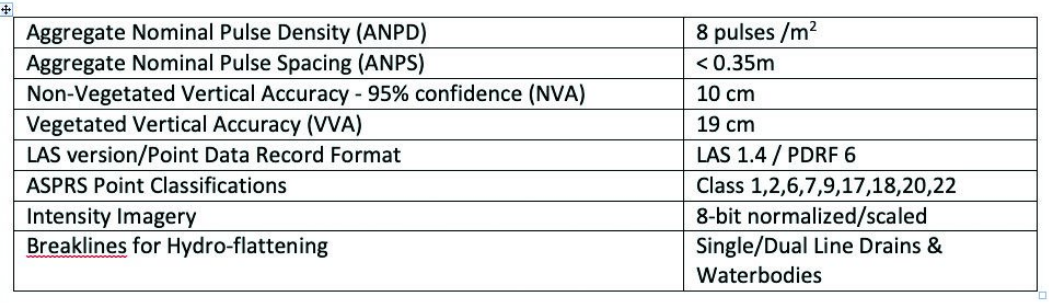
USGS Quality-level 1 specifications for the Peninsula of Florida mapping.
Weather
Although the flight window occurred in the “dry-season/leaf-off” season, there is never really a dry-season/leaf-off in Florida. Vegetation in South Florida is always leafed-out, and rain events can deliver more than two inches each. To help ensure accurate ground mapping, a specification to the data-collection precluded data acquisition within 72 hours of a 0.5-inch rain event. This resulted in several days of no data collection during the flight season.
Tides
Of the 45 counties in the program, 19 are coastal: 10 on the Atlantic Coast and 9 on the Gulf Coast. A specification to the collection included lidar mapping to “at least” NAVD88 0-feet. On the western side of the state, along the Gulf Coast of Mexico, there are typically two tides/day during the flight season. The Gulf tides limited missions not to exceed six hours. On the eastern side, along the Atlantic Ocean, tides range approximately four feet in a north-south direction, again potentially introducing severe tidal/temporal effects along the east coast.
Airspace Restrictions
The flight window during the late fall/early winter is also the optimal season for northern visitors to the state, including visitors to the Mar-a-Lago resort area on the eastern coast. Presidential visits required closing access to the airspace. Similarly, on the West Coast, Tampa is the site of MacDill Air Force Base, the home of the U.S. Central Command. The restricted airspace over these facilities, along with major, 24-hour, international airports in Tampa, Orlando, West Palm Beach, Jacksonville, and Miami, required close coordination with both military and civilian Air Traffic Control.
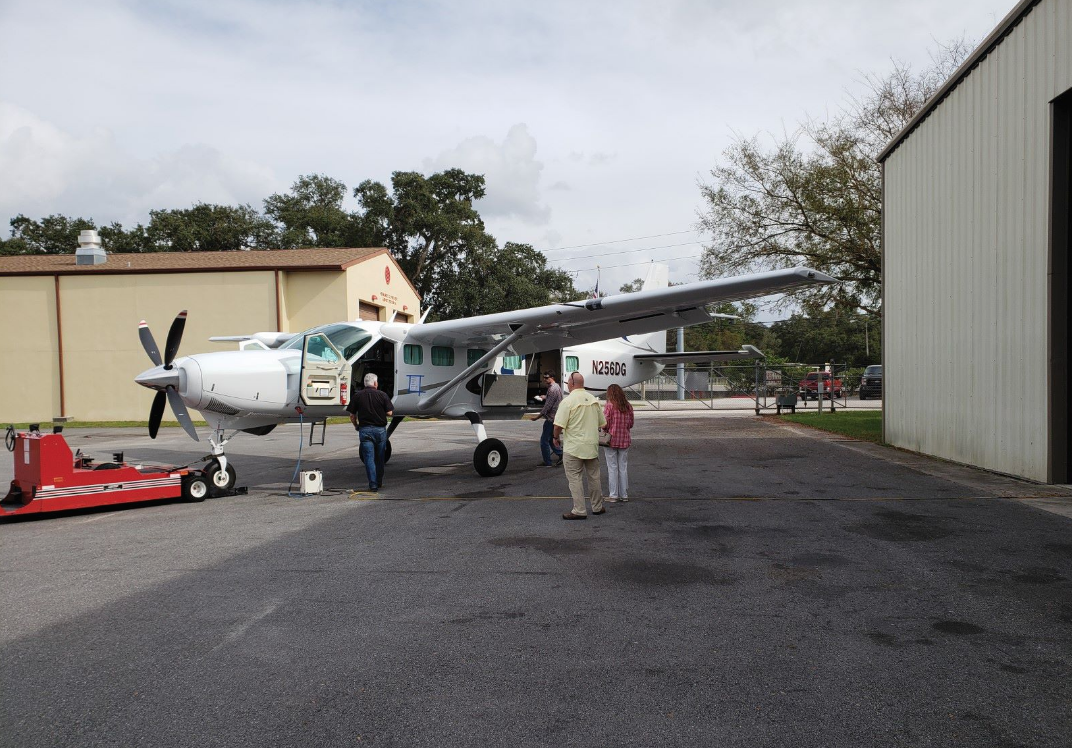
Aircraft used by one of Dewberry’s acquisition partners prior to a calibration flight. Credit: the Dowe Gallagher Airborne Data Group.
Advantages of State-wide Mapping
Although large-area, statewide lidar collections present some challenges, there are also several distinct advantages for these types of collections.
“We have found that there is an ‘economy of scale’ to be gained that results from large areas being mapped,” says Elise MacPherson, PMP, senior project manager with Dewberry. “Mobilization and demobilizations, acquisition, and unit-area costs are all minimized, as are costs associated with project management.”
Other advantages include the following.
The collection of high-resolution lidar data can be used across multiple state and local agencies, as well as private enterprises. The coordination of large data collections reduces redundancy in project costs, management, and data storage.
The resulting topography and elevations models are more consistent. Watersheds do not respect geopolitical (i.e., county) boundaries, so having uniform, seamless terrain maps facilitates modeling and planning activities in watersheds and hydrological units and along corridors that may cross multiple counties.
The 2017 Florida Statewide Lidar Assessment indicated that the state would realize a net benefit of more than $20 million per year for Quality Level 1 topographic lidar acquired every two to three years. Statewide collections eliminate “piecemeal” collections, reduce redundancy, and facilitate regular updates of seamless, uniform topographic data.
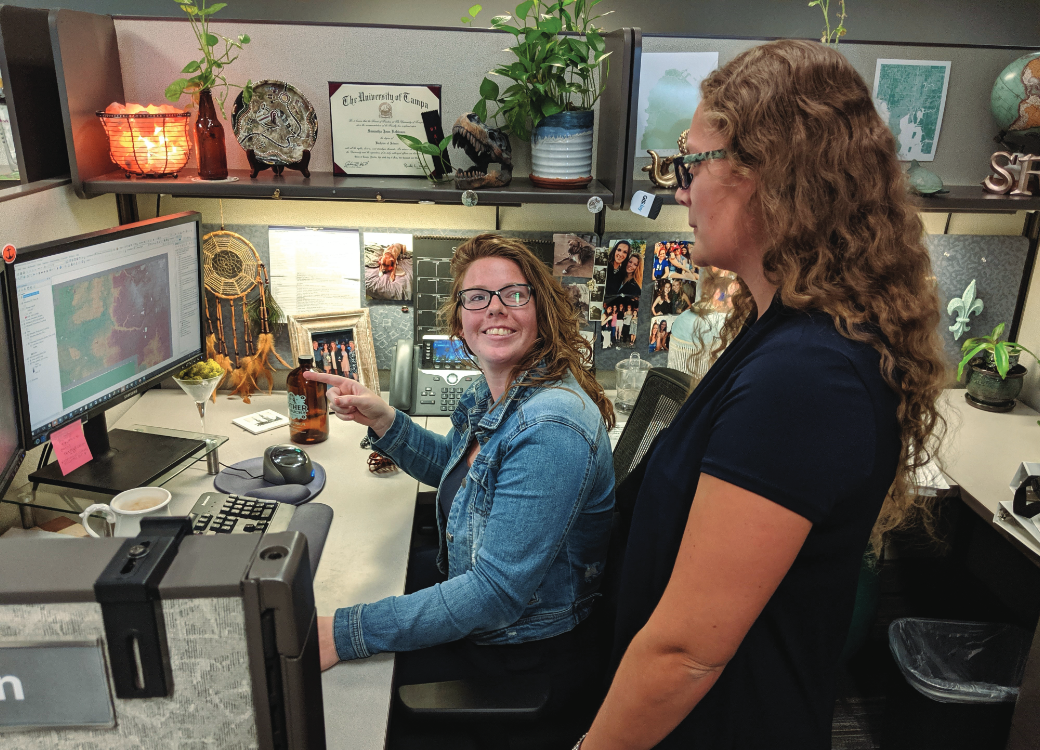
Dewberry lidar analysts Samantha Robinson (seated) and Cheyenne Hinson review a digital elevation model for the project.
Contributing to 3DEP
Since the initiation of the USGS 3D Elevation Program (3DEP) in 2016, Dewberry has worked with the USGS in cooperation with Florida state agencies to map more than 22,000 square miles of Florida. These efforts have resulted in mapping the Panhandle of Florida and selected watersheds along the East Coast to the USGS Quality-level 2 specification. The current project’s goal is to map the peninsula to a higher level: USGS Quality-level 1.
“We look forward to completing the mapping of the Florida peninsula by early 2021,” says MacPherson. “The data will become part of the high-resolution, elevation data inventory within the USGS 3D Elevation Program (3DEP) and the U.S. National Map by late 2021.”
“This project supports the Geographic Information Office’s objectives of geospatial data sharing across agency and geographic boundaries while reducing redundancies,” says Kimberly Jackson, GISP, Florida state geographic information officer.
“Access to this statewide spatial dataset will immediately and positively impact businesses, universities, non-governmental organizations, water management districts, and state agencies in Florida as outlined in the Florida Department of Environmental Protection’s 2018 Statewide LiDAR Assessment report to the legislature.”