For 30 years, an Alaska-based company has been producing digital mapping and photogrammetic software to help automate the complex work of data interpretation.
Photogrammetry, long the foundation of mapping, has evolved much since 1987 when DAT/EM Systems International was founded.
Despite all the advances in both hardware and software, however, the latter cannot yet reliably differentiate among, say, building edges, utilities, and fence lines or between a small car and a rock boulder. Therefore, human operators are still required to interpret what they see in a 3D stereo model.
“The ultimate goal is to make as much of the whole workflow as automated as possible,” says Jeffrey Yates, the company’s general manager, who’s been in the business since 1982.
DAT/EM develops products to extract and edit 3D terrain and object features from stereo imagery, point clouds, and UAS data. Based in Anchorage, Alaska, the company has been developing digital mapping and photogrammetric software and hardware since its founding, serving photogrammetric firms, engineering companies, and government and non-government agencies worldwide.
The DAT/EM Photogrammetric Suite includes the Summit Evolution digital photogrammetric workstation and the LandScape point cloud viewing and editing toolkit, with the complementary components Capture, MapEditor, Ortho+Mosaic, Airfield3D, Contour Creator, and Summit UAS.
The following are descriptions of different uses of DAT/EM software by four of the company’s clients.
Mapping the Canary Islands
GRAFCAN, a public company founded in 1989, produces all of the cartography for the Canary Islands. It is a client of GTBIbrica,
a Summit Evolution reseller in Spain. GRAFCAN began by performing cartography quality control; then in 2009 it began to produce its own cartography products. In 2011, it began working with TrimbleÕs Inpho software and the Summit Evolution family of products.
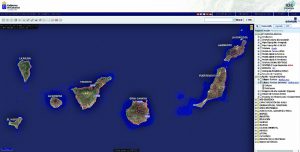
GRAFCAN produces all of the cartography for the Canary Islands.
Once a year, GRAFCAN flies its plane over the entire Canary Islands (both a high-altitude flight and a low-altitude flight) with a digital camera to meet the requirements of the local governments. It then compares the data it collected with the cartography that it wants to update and records all the changes in a geodatabase of the whole Canary Islands at scale 1:5,000, with the urban centers at scale 1:1,000.
“We store the coordinates of the changes, open the project, and update the vector data and the cartography,” explains Francisco Suarez, products manager. “We go one change at a time.”
The company also produces orthos and DTMs using Inpho. Inpho and Summit Evolution are compatible, which makes it easy for GRAFCAN to produce orthos and DTMs with the former and then use them in the latter, Suarez points out.
GRAFCAN, Suarez recalls, selected Summit Evolution because it allows it to “just load a single project and move around very easily, which makes it very fast to review and update the cartography.”
Additionally, the Capture interface for enabled Summit products digitizes image features from a Summit Evolution project directly into ArcGIS, which is the format that GRAFCAN uses to publish its data on its website. “It would be nice for us to be able to switch in Summit Evolution from photos from our high-altitude flight to photos from our low-altitude flight.”
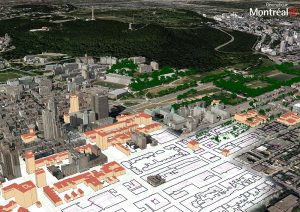
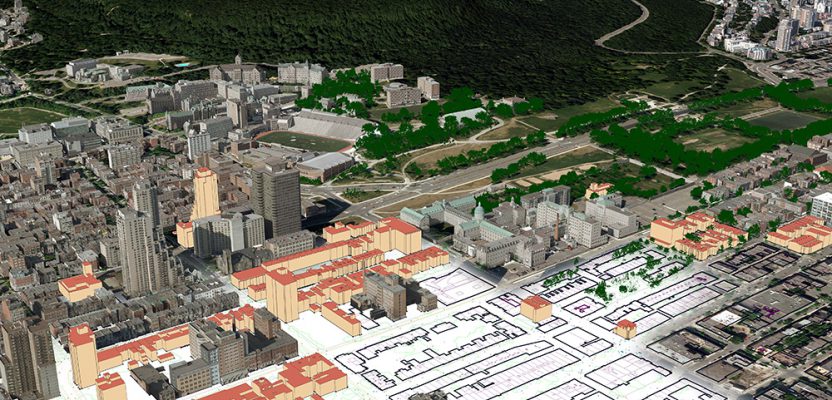
This city map of Montreal, scale 1:1,000, was created with aerial orthophotos, DTM, 3D GIS, and a lidar point cloud.
Mapping Montreal
Simon Gignac is a surveyor for the city of Montreal, Quebec. He recalls, “The city began using photogrammetry in 1967 to create the city map, and we have used DAT/EM Summit Evolution perhaps since 2011.”
The Communaute metropolitaine de Montreal (CMM), a regional planning agency, flies aerial photography every year or two. “We use this imagery and do aerial triangulation, then some photogrammetry.”
Gignac’s office uses this photogrammetry and terrain surveys to update features – such as roads, public services, and tree canopies – that it extracts from city data, then uses the photogrammetry to construct the other themes (such as buildings, hydrography, railways, and high-voltage lines) and aerial lidar to produce the contours.
“We work thematically,” says Gignac. “For example, in one file we do transportation-related features, such as roads, sidewalks, and bike paths. In another file we do hydrography: rivers, dams, etc.”
The group then imports its Microstation file into Safe Software’s FME, where it compiles its themes, structures the data, then cuts sheets to create the map at a scale of 1:1,000. The final product is a Microstation file, an AutoCAD file, or a PDF file.
“The data come from multiple sources, generated by various acquisition methods, and representing different moments in time,” Gignac points out. “We have special projects all the time. For example, right now, we are mapping the flood area, using lidar and photogrammetry.”
In April 2016, CMM acquired aerial photography at a 6 cm pixel resolution. The City of Montreal installed 145 photogrammetric targets on its territory, and then a land surveyor conducted a high-quality aerotriangulation to ensure the accuracy of the stereomodels.
“Verification with field surveys allowed us to deduce that the relative accuracy in the three axes is ± 7 cm at a 1 sigma,” says Gignac.
Supplementing the photogrammetric survey with a GPS RTK field survey, his office made topographic maps for preliminary design purposes for road infrastructure reconstruction work. The final product was a map at a scale of 1: 500. If the road work proceeds, civil engineers will carry out a centimeter-level field survey.
Mapping Landfills
Miller Creek Associates (MCA) does not own any planes, though it does have a couple of UAVs. Its biggest client covers about 50 landfills in Alaska, Hawaii, Washington, Oregon, and California.
MCA updates planimetric, topographic, and contour maps.
“We’ve branched out to many engineering firms in the area,” says Jimmy Schulz, CTO and chief technician of MCA. “We’ve been doing more highway projects lately. We’ve done some fairly large gas pipeline lidar projects on the East Coast.”
Schulz has been using DAT/EM software for about eight years.
Schulz describes the Lidar Image Generator as one of DAT/EM software’s “hidden gems.” Using clever processing technology, he explains, the package generates a stereo pair and summit project from a lidar dataset.
“It makes for an excellent tool for planimetric collection from lidar data. It also functions as a very efficient tool for QC of lidar data.”
Initially, users could only run one instance of it at a time, which was a slow process for MCA’s huge lidar data sets. “I asked them to break that out so that we could run multiple instances, and they did. Now, we can run it eight times faster.”
For a recent project that required evaluating the quality of a mobile lidar dataset, MCA used Lidar Image Generator to create a stereo project from a public source lidar dataset.
“By superimposing the client’s mobile lidar data in stereo,” Schulz explains, “we were able to both confirm areas of concern and verify areas where the data fit well. It also allowed us to QC the ground classification of the mobile data.”
Summit Professional, Schulz says, has become the workhorse of MCA’s stereo production environment, and they use the Capture/MapEditor tools for their cartographic QC, editing, and map finishing. He describes the workflow for a typical project as follows:
- A/T the imagery in Inpho Match AT,
- convert the project to a Summit Project file,
- compile the planimetry and topography in Summit Pro,
- QC the map collection in Summit Pro, and
- edit/cartographically finish the map using a series of batches and tools in DAT/EM Map/Editor.
For AGIS airport projects, MCA uses DAT/EM’s Airfield3D, along with Capture for ArcGIS and Summit Pro, to collect airports’ AGIS data according to a strict protocol and standard.
“Airfield3D provides visualization tools, as well as behind-the-scenes calculations that greatly simplify a very complex specification for a production environment,” Schulz explains.
“DAT/EM software […] provides continuity across so many platforms. This allows our staff to get very proficient with the tools and use them on many different kinds of projects. As an example, we recently acquired some UAV imagery data and brought the stereo into Summit. The project conversion was seamless, and we will be able to utilize our staff’s existing skill sets with DAT/EM software on UAV projects.”
Mapping From Space
Airbus DS Geo SGSA – part of the Intelligence Business Cluster of the Defense and Space division of the Airbus Group – specializes in map production. It produces topographic maps, mainly urban maps at very large scales, such as 1:1,000, as well as topographic maps from the Airbus Earth Observation satellites.
Specifically, Geo SGSA uses images from the two twin Plieades satellites, which have a 0.5 m pixel size, to produce maps at a scale of 1:5,000, and images from the SPOT 6 and 7 satellites, which have a 1.5 m pixel size, to produce maps at 1:25,000 scale.
Airbus DS Geo SGSA produces topographic maps, mainly urban maps at very large scales.
“Map production represents approximately half of our business in Spain,” says Santi Costa, product manager at Airbus DS Geo SGSA, in Barcelona. “The other half is related to everything that comes from the Airbus Intelligence portfolio, services and products that are mainly created from our Earth Observation satellites.
“We sell images, monitoring and tasking services, reference layers such as elevation models or orthophoto coverages, reception services, etc. We also sell C4ISR [command, control, communications, computers, intelligence, surveillance, and reconnaissance] solutions, platforms and software, such as Vector Factory.”
According to Costa, who has been working in the mapping and software business for more than 25 years and is in charge of software product management for Vector Factory, the product “simplifies vector data capture and works great together with Summit Evolution for ArcGIS.”
Geo SGSA’s main customers for large-scale maps are regional and local governments, such as the Cartographic and Geologic Institute of Catalonia, which has its own planes and sensors, including two Intergraph DMC cameras. The company uses the Institute’s aerial images, which have a pixel size of 7 cm to 8 cm, to produce its urban maps at a scale of 1:1,000.
Geo SGSA began using Summit Evolution around 2010, Costa recalls, when it took advantage of a DAT/EM offer to upgrade from DiAP digital stereo-plotters to Summit Evolution.
“After analyzing the market, we saw that all the vector geo-information produced would end up in a GIS for its further analysis and exploitation. So, we decided to modernize our production process and keep all the geo-information lifecycle in the same platform. Summit Evolution already had one version that connected the photogrammetric system to ArcGIS.”
However, while image quality greatly improved, vector display in the new GIS environment was much slower than it had been in CAD. In order to help its operators digitize and edit faster, the company began to develop what became Vector Factory.
“We are very happy with the way Summit Evolution works with ArcMap,” Costa says. “It is very transparent. Our operators like it a lot because of the smooth dynamic panning. Even more important is that it can import many, many different orientations from all the different aerial triangulation packages or directly read most of the satellite sensors. You can also work with UAVs.”
Summit Evolution is Geo SGSAÕs photogrammetric stereoscopic environment, which it uses in all of its projects to capture or edit any 3D vector information. For example, in doing contract work for an engineering company that requires very precise geoinformation to develop new infrastructure in South America, it produces topographic maps at 1:5,000 scale using Pleiades satellite imagery. Geo SGSA tasks the satellites to collect imagery of the area, then loads it and the georeferencing metadata into Summit Evolution.
“We spread the work across all of our operators, which are eight at this moment, and we start compiling all the vector information,” says Costa.
“We use a GIS data model that we developed by ourselves and with our Vector Factory,” Costa explains. “We implement this data model in a way that is very standardized across all the operators in our team. So, at the end, the data is homogeneous, and it is easy to manage the work. We don’t have to edit the information after the operator completes the stereoscopic capture.”
This article is part of the February 2018 magazine. Click on the cover below to view the other articles in the February 2018 issue of xyHt magazine.