The City of Durham prepares for growth by collecting and leveraging data through a web-based GIS—to create a hydraulic model for its wastewater collection system.
Durham, North Carolina is experiencing a growth rate it has never before known, with more people moving in, per capita, than all but three other cities in the country.
Durham’s Department of Water Management is one of many divisions focused on preparing the city for rapid growth while preserving the history and character that defines the area.
Corrie Bondar, a civil engineer at the department, identified the need for a hydraulic model of Durham’s comprehensive wastewater collection system for the City to plan infrastructure improvements, develop operational maintenance strategies, and proactively manage a system under duress from a growing population.
“With some 20 new residents moving to Durham every day, the demand for resources such as housing, jobs, and even water—along with the reliable infrastructure to move it to and through the city—has never been stronger,” says Bondar.
The city contracted the national AEC consulting firm Freese and Nichols Inc. and its team of subcontractors to develop a hydraulic model designed to keep up with its evolving needs.
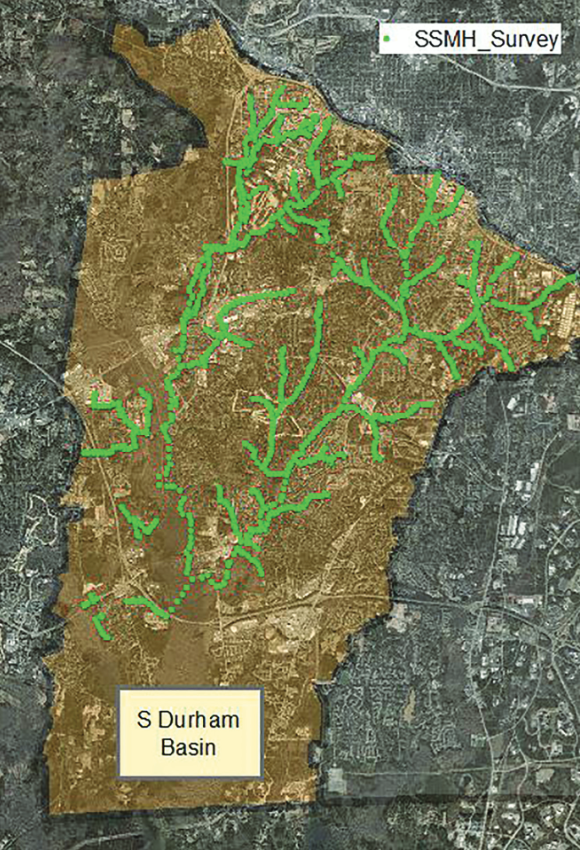
The limits of the project area and individual manholes along the sewer lines.
Inconsistent GIS Inventory
Considering that a hydraulic model is only as good as the data used to build it, an essential part of the design process was to update the existing geographic information system (GIS) inventory. Stewart, an interdisciplinary design, engineering, and planning firm where I’m a senior geomatics project manager, took the lead in refreshing the city’s existing sewer GIS inventory as part of the Freese and Nichols team.
The Stewart geomatics team knew that the existing inventory had been compiled over many years from several sources, resulting in data inconsistencies. At the project’s commencement, among the unknowns were the history of the inventory, the accuracy of the data, how it was collected, and by whom.
To seamlessly integrate this data into the hydraulic model, Stewart approached the challenge with a combination of conventional survey and web-based GIS, such as Collector for ArcGIS, to provide reliable updates to the inventory.
Real-time Value with Digital Data Collection
Historically, surveying underground gravity lines like sewer and storm drainage was handled with field books filled with notes, sketches, and hardcopy maps. The advancement of web-based GIS has made it easier for fast-growing cities like Durham to move to an all-digital data-collection and -attribution system that delivers several advantages over a traditional workflow.
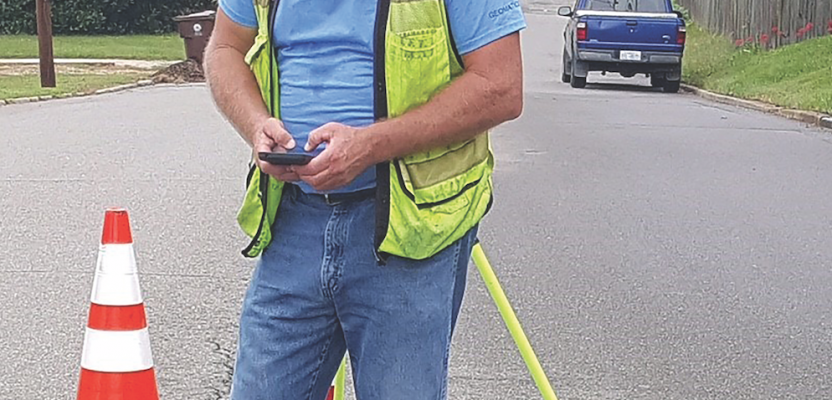
A Stewart geomatics team member enters data in Collector on his iPhone.
From a technical standpoint, these advantages include eliminating redundant data input, improved consistency, and automated quality-control checks. Further, hosting project-scoping data in a GIS environment allows GPS-enabled devices to provide situational awareness, which is key for communication of the scope with field staff.
To collect data for this project, Stewart used Esri’s Collector on both Android and iOS devices, and the team surveyed horizontal and vertical positions using either GNSS receivers or total stations. Stewart used the North Carolina Geodetic Survey statewide real-time network as primary control, and the team integrated the surveyed positions into the GIS on the back-end using ArcGIS Desktop.
To leverage the data, Stewart developed a dashboard using Web AppBuilder for ArcGIS to provide real-time status reporting for the city and to schedule tracking for the project team. No software or subscriptions were required, and the map could be viewed on any device with an internet connection.
With this new, cloud-based dashboard, city engineers could instantly view any edits made in the field from their desktops or smart phones and watch Stewart’s progress and updates in real-time. This level of transparency allowed everyone to monitor, plan, and coordinate other projects with an accurate timeline.
In addition, the city often received phone calls from residents inquiring about surveyors in their neighborhoods or operating within the area. With the dashboard’s enhanced visibility and transparency, the city staff members were able to pinpoint when and where Stewart’s geomatics practice was surveying that day in order to answer questions.
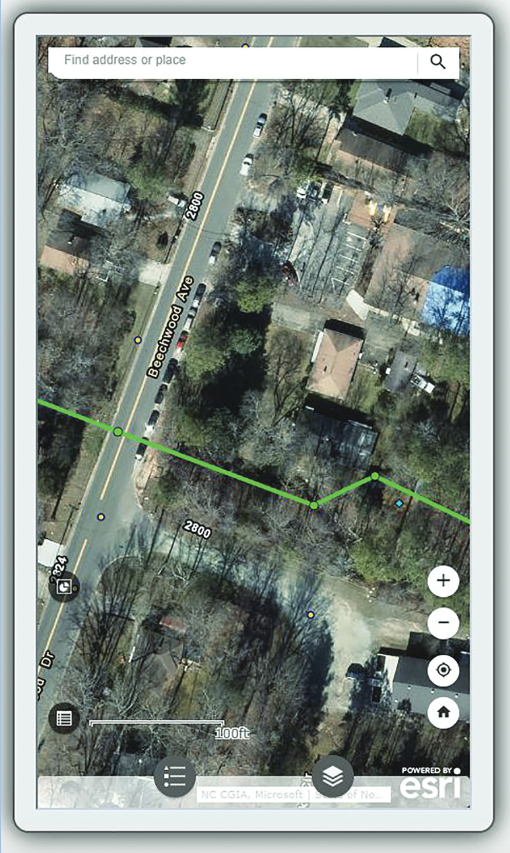
A screenshot of the Collector application on an iPhone.
Efficient Routine Checks
With any attempt to update a city’s historic infrastructure data, a common challenge is efficiently identifying inaccuracies in the first place. A GIS environment helps make routine quality control checks much more efficient by employing automated and semi-automatic tools. This is particularly useful for projects in growing cities like Durham with hundreds or thousands of features.
For example, completeness checks, connectivity, slope analysis, and checking rim or adjacent grade elevations against a lidar dataset or digital terrain model can largely be handled with scripts. This can be performed in seconds across the dataset, allowing only the features that need attention to be revealed.
Efficiently checking the dataset using multiple criteria also adds to the confidence in the data’s accuracy. As the Stewart team collected more data in Durham, we compared survey positions against the existing inventory as a quality control check and reported any noticeable inconsistencies between datasets.
Building Confidence for the Future
In describing how the hydraulic model will benefit the city, Bondar said, “The comprehensive hydraulic model will be used to evaluate the sewer collection system needs for increasing capacity, efficiency, and proposed development.
“It will be an essential tool for master planning and assisting with the Department of Water Management’s efforts to renew an aging sewer system, reduce rain-derived inflow and infiltration, and restore capacity in mains and at lift stations. The hydraulic model will also be an invaluable tool to evaluate infrastructure impacts of development scenarios for the City’s Comprehensive Plan update.”
As the City of Durham quickly moves toward a population of 320,000, its strategy for welcoming new residents continues to evolve. Stewart’s use of technology for accurate data sets and a comprehensive hydraulic model gave the city confidence that its infrastructure is reliable and functional and that the City of Durham is better prepared for increased growth and progress.
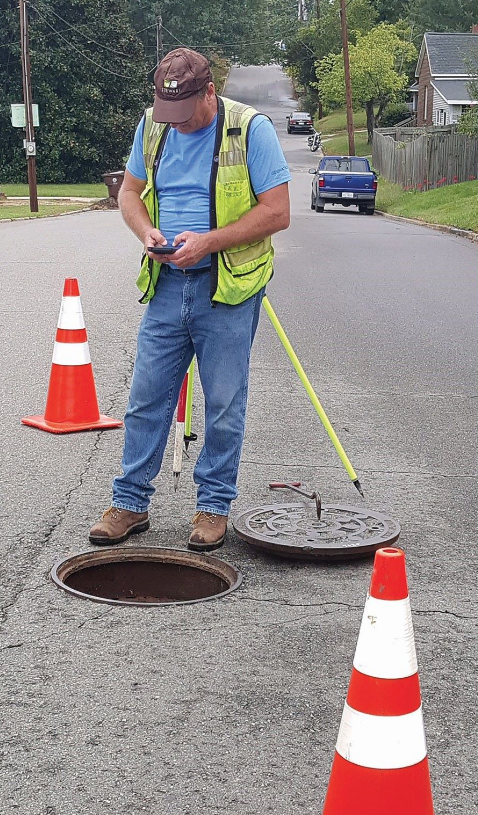
Sidebar: Missing Manhole
A small (but significant) outcome of the web-based GIS providing situational awareness was that it led to the discovery of a buried manhole. The particular manhole had multiple outstanding work orders to locate, uncover, and raise it, dating back several years. Due to the new reliable data and enhanced accuracy, the City was able to raise it, close half a dozen open work orders, and, in turn, better serve the City and community.
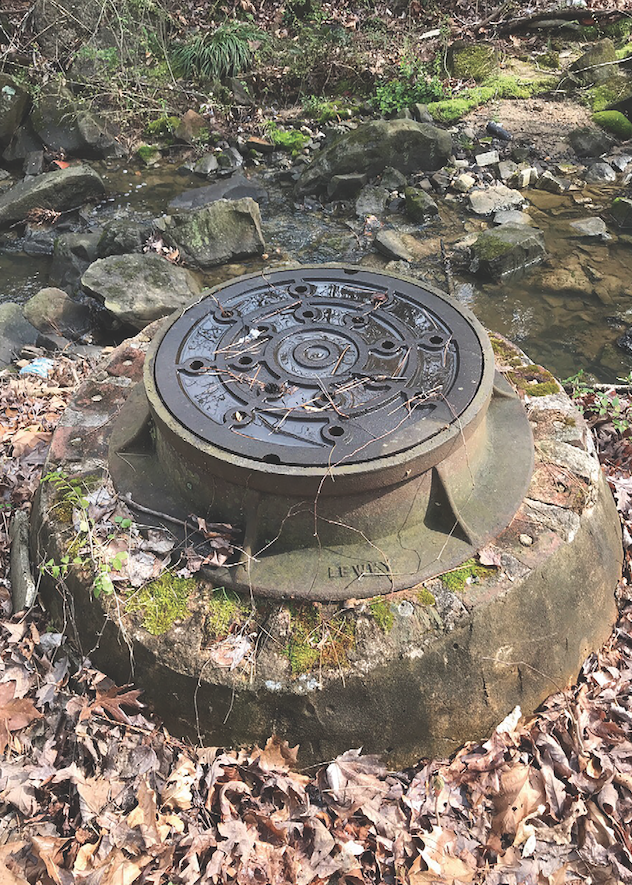
Found!