
We’re battling surveying and mapping equipment theft in South Florida and we need your help.
Data collection is the foundation from which maps are made, and a majority of this data has its origins in the field. Unfortunately, criminals repeatedly target the equipment used by surveyors and mappers due to the instruments’ value and relative portability.
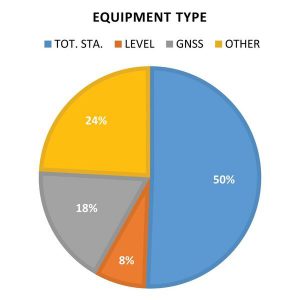
FIGURE 1: Percentage of each predominant type of surveying and mapping equipment reported stolen from 2002 through May 2017 (n > 500). The “other” category includes data collectors, field computers, and miscellaneous high-value surveying equipment items stolen during this time period.
To better understand the magnitude of this criminal activity, the Florida Surveying and Mapping Society (FSMS) and the University of Florida (UF) geomatics program at the UF/IFAS Fort Lauderdale Research and Education Center maintain a database of crimes involving surveying and mapping equipment. Targets of these crimes include GNSS receivers, total stations, levels, laser scanners, and hydrographic surveying equipment.
According to the complete reports in the database, more than 260 total stations and 90 GNSS receivers were stolen over the past 15 years. Figure 1 shows the distribution of the surveying equipment by instrument type.
As shown in Figure 2, southeast Florida, specifically Palm Beach, Broward, and Miami-Dade counties, has been particularly hard hit.
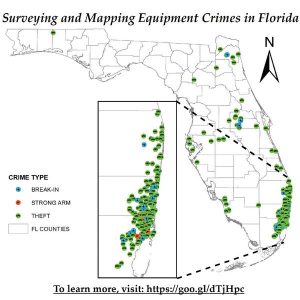
FIGURE 2: Map of reported crime locations involving surveying equipment from 2002 through May 2017 in Florida, with an inset map featuring Miami-Dade, Broward, and Palm Beach counties.
The equipment values of the 313 reported crimes from 2002 through May 2017 offer further evidence that these crimes significantly impact finances across the surveying and mapping profession. Table 1 shows the total reported value of stolen goods to be about $5.6 million over this 15-year time period.
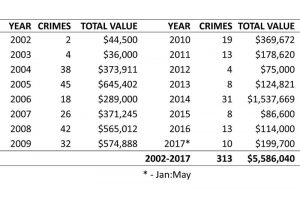
TABLE 1: Summary of crimes involving surveying and mapping equipment.
With almost $200,000 worth of reported equipment stolen in the first five months of 2017, it is critical that awareness of this criminal activity is raised with other professions and professionals who may use this equipment. Further, it is particularly concerning that the reported crimes are spreading north, covering northeastern and central areas of Florida over the first few months of 2017.
Efforts have been taken in the south Florida surveying and mapping profession to instill vigilance in field crews regarding the protection of this equipment. Whereas the exact reasons for the downward trend in survey-related crimes since 2005 are unknown, we assume that a substantial part of the drop in reported crimes can be attributed to enhanced vigilance in the field and local awareness campaigns about ongoing equipment thefts in southeastern Florida (Figure 3).
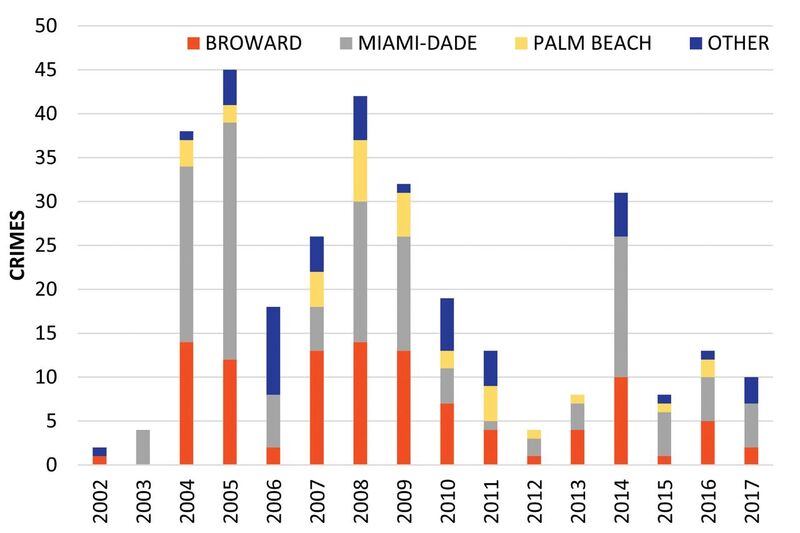
FIGURE 3: Number of crimes involving surveying and mapping equipment by year. Data is organized into three urban countries in the southeastern FL tri-county area and other counties.
The large spike in the total value of stolen goods in 2014 shown in Figure 4 can be attributed to a rash of break-ins at surveying and mapping firm offices. Communication about surveying equipment theft amongst firms helped reduce the number of successful office break-ins from 2015 through the present. However, this does not mean that the problem is solved. Vigilance and communication are paramount.
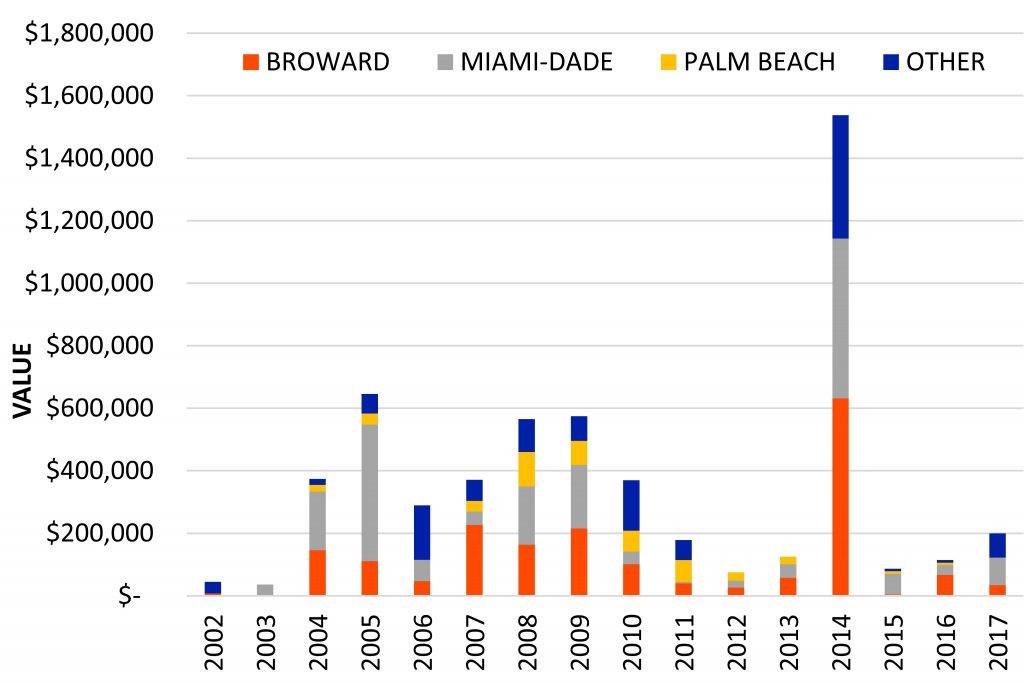
FIGURE 4: Value of thefts of surveying and mapping equipment by year, organized by county.
Best Practices
For best practices in the field, the following is a list of items that attentive surveying crews have been abiding by in an attempt to thwart would-be thefts both at and travelling to job sites and in offices.
- When loading or unloading equipment from the office or at any job site, pay attention to your surroundings to ensure you’re not being watched by suspicious vehicles/persons.
- When leaving a jobsite, watch to see if anyone is following. The criminals are looking for an opportunity to snatch and grab when the crew is not paying attention.
- When the crew goes to lunch or stops for a break, do not leave equipment unattended in a truck. Either take the equipment into the restaurant or leave someone in the vehicle with it.
- Take pictures of any suspicious vehicles and their tags with your smartphone.
- Be suspicious of anyone hanging around a jobsite.
- Be careful when setting up a jobsite. Try not to set up where it might be convenient for a truck to pull up right next to the equipment and snatch it while the crew members are not paying attention.
- Stay within five steps of the instrument at all times because it takes only a few seconds to jump out of a car or truck, grab it, and take off.
- A job located inside a construction fence can provide a false sense of security. Remain vigilant by taking precautions and monitoring activity of others onsite.
- Thieves are opportunistic and willing to commit survey-equipment-related theft any day of the week. For office security, most break-ins occur on the weekends (12 of the 18 reported, Figure 5). Therefore, take extra security measures to secure of- fices during the weekends.
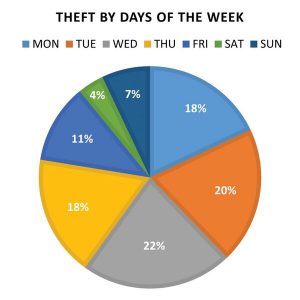
FIGURE 5: Distribution of survey equipment thefts, including office break-ins, by days of the week (n = 313).
Reporting
If an incident unfortunately does occur, report any crimes or attempts immediately to the local police or sheriff. Additionally, provide details to your local FSMS chapter/district so an alert can be sent to everyone in the area. If you would like to receive these theft alerts, please contact Rick Pryce to be added to the mailing list.
Finally, self-report a crime to the database by completing the Crime Report Form
and sending it to the University of Florida for database updates. This self-reporting includes both recent crimes and crimes that may have happened years prior. Maintaining a complete database is important, as FSMS and UF Geomatics collaborate with local and statewide law enforcement agencies in conveying the magnitude of the problem.
With effective communication of these crimes, appropriate resources can be allocated to combat surveying and mapping equipment theft.
For those who have not yet experienced equipment thefts but would like to learn more about our experiences and how you can protect yourself and your local professional community, please reach out to us for advice. As a profession, we’re in this together.
Resources
- A dynamic map of survey equipment crime in FL
- Crime Report Form
- Rick Pryce: rpryce@craventhompson.com
- Adam Benjamin: abenjamin1@ufl.edu
- Dr. Henry Hochmair: hhhochmair@ufl.edu
To read the rest of the articles in this print issue, click on the issue cover, below.