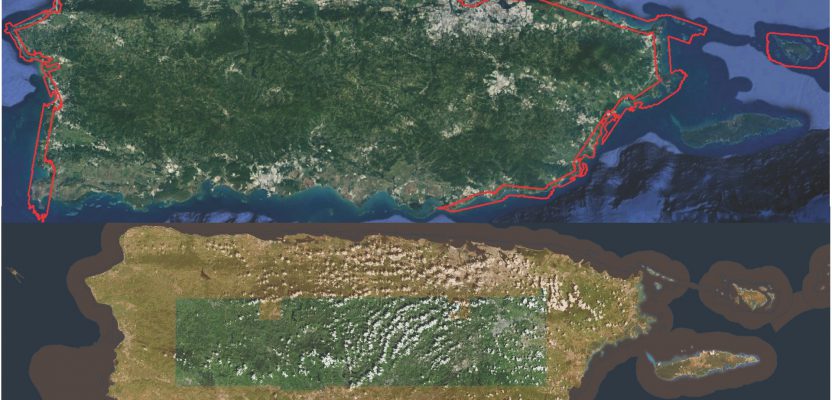
Above image: Puerto Rico was surveyed using the Coastal Zone Mapping and Imaging Lidar system to provide efficient damage assessment. Image courtesy of the Joint Airborne Technical Center of Expertise.
Post-hurricane coastal mapping is a complex process made easier with airborne bathymetry.
Lately, large storms such as hurricanes, cyclones, and typhoons have been wreaking havoc on coastal communities. Two Category 4 storms hit the United States in 2017, and one has made landfall so far in 2018.
These storms move so much sand and sediment around on the seafloor that they often make areas that were previously deep enough for navigation now several meters shallower, requiring new surveys before ships can safely traverse them.
These storms also create special logistical and technical challenges for surveyors. To overcome these challenges and help with disaster recovery, the U.S. Army Corps of Engineers (USACE) has been mapping coastal zones after hurricanes using airborne bathymetric lidar.
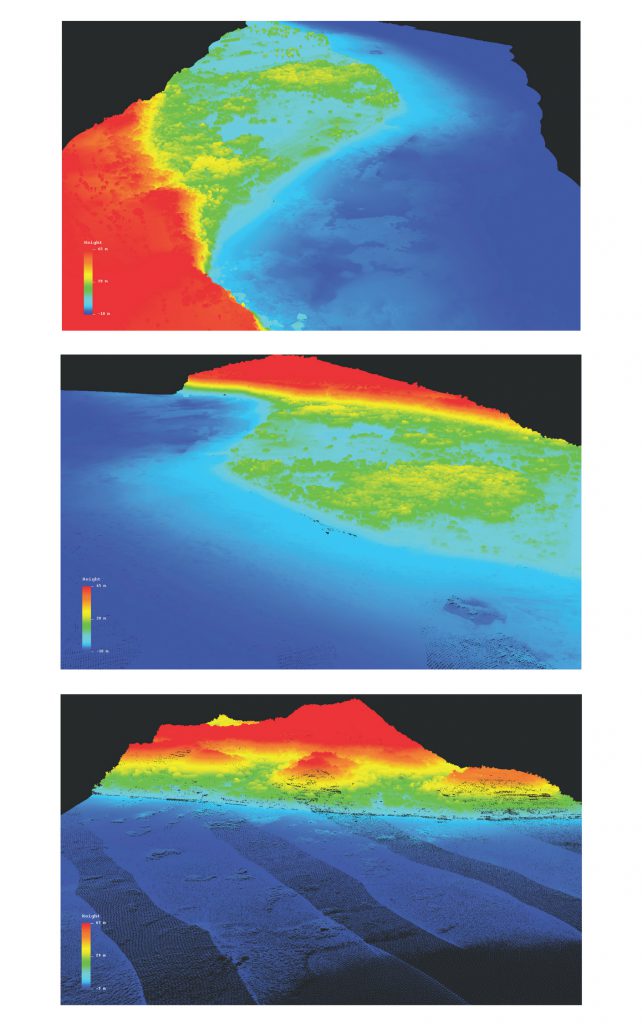
CZMIL lidar 3D point cloud of Puerto Rico, displaying the land/water interface, seafloor, and topographic data colored by elevation (ellipsoid height). Images courtesy of the Joint Airborne Technical Center of Expertise.
The Challenges
“The biggest challenge in post-hurricane coastal mapping is getting data processed and cleaned quickly to create some products and assess damage,” says Brant Smith, a research engineer at Teledyne Optech, the company that makes the Coastal Zone Mapping and Imaging Lidar (CZMIL) system that the USACE uses.
“The biggest pressure will always be time because everyone always wants to know immediately, ‘How much damage is there? What happened? What can we do?'”
Airborne lidar enables surveyors to reach the affected area quickly from their base location and fly it while sea vessels are waiting for port facilities to be repaired and reopened. They can then immediately begin to process the data and compare it to previous maps of the area. By surveying both land and water, they can get a complete view of the coastal zone and look for erosion or damage both above and below the shoreline.
After a large storm, ground survey teams also face the same logistical challenges as rescuers in any disaster: lack of resources.
“Hotels, rental cars, and gas are being consumed by people who were impacted by the storm or by emergency responders,” says Jennifer Wozencraft, the director of the Joint Airborne Lidar Bathymetry Technical Center of Expertise and the program manager for USACE’s National Coastal Mapping Program.
(Wozencraft is the primary point of contact for USACE’s mapping efforts using bathymetry after storms. She helps staff both in her own agency and at other agencies detail their requirements and then develop—in coordination with Optech, an operations contractor, and government science staff—products that are specifically geared toward using CZMIL data to support disaster response.)
“Depending on the severity of the storm, basics like electricity, water, and food are scarce. So, one of the benefits of the CZMIL system is that we can efficiently fly from a stand-off location, collect the data, process it, and turn it around on a daily basis, without requiring any ground control. We do generally go back and collect check points at the end, but we also have pre-event data to which we can compare it as a quality check.”
A third challenge to bathymetric surveying after a large storm is that, depending on how soon after a storm surveying can begin, the water will be full of floating debris and turbidity plumes, which laser pulses cannot penetrate. To obviate this problem, airborne surveys may be collected for the same area at different times. Team members can overlay them and then replace the obstructed portions with unobstructed ones.
“If there is something floating in the water that will keep moving, it may have moved out of the way when they do a second pass,” Smith points out.
Bathymetric Tools
The USACE’s CZMIL integrates a lidar sensor with simultaneous topographic and bathymetric capabilities, a digital camera, and a hyperspectral imager on a single remote sensing platform for use in coastal mapping and charting activities. The system, which has a split receiver, collects topobathy lidar data at 10 kHz in deep channels, at 70 kHz in shallow channels, and at 80 kHz on land, as well as RGB imagery. A CASI-1500 hyperspectral line scanner is integrated with the system, as well.
All raw data streams are transferred to the office for downloading and processing in CZMIL’s Hydro Fusion software. Aircraft position data are processed using POSPac software, and the results are combined with the lidar data to produce 3D positions for each lidar shot.
CZMIL is often used for post-hurricane coastal zone mapping, usually at a depth of 50 meters or less. Its bathymetric lidar is integrated with a hyperspectral imaging system and a digital metric camera, producing simultaneous high-resolution 3D data and imagery of the beach and shallow water seafloor, including coastal topography, benthic classification, and water column characterization.
Optech HydroFusion, a software suite, handles all three sensorsбfrom mission planning to fused lidar and imagery data sets.
CZMIL is also good for “depth performance,” says Wozencraft. “It gives us the greatest chance to actually see through the water column to the sea floor after a storm event. USACE and others for whom we work are concerned about the loss of beach sand, which requires seeing through the dune vegetation. Because of the circular scanning and waveform resolving lidar, we have a lot of good capability to get through the denser vegetation.”
Using CZMIL and prior generation systems, USACEеs National Coastal Mapping program has mapped the sandy U.S. coastline twice since the program started in 2004 and is working on a third survey around the country. Hurricane-impacted areas like the Florida Atlantic Coast have been surveyed up to seven times. By comparing post-hurricane surveys with these base maps, scientists can determine how beaches and seafloors have changed and how the shoreline itself has moved.
In 2015, the CZMIL was used to survey the southeast Atlantic Coast from Florida through Virginia very soon after Hurricane Matthew and after Hurricane Irma on the Florida coast. In 2012, it was used after Superstorm Sandy in New York and New Jersey.
Using CZMIL, surveyors “can cover all of the affected area pretty quickly and then get back and immediately start working on data,” says Smith. “A smaller crew is needed to fly the survey and they can do it much quicker.”
The Workflow
Hurricanes do not change how airborne surveys are flown because, unlike on the ground and in the water, there are no new obstacles. “Depending on the complexity of the shoreline,” Wozencraft explains, “we will survey a 10- to 30-mile-long block of flight lines. Typically, our blocks are 1/2- to 30-mile wide for hurricane response, which is probably five to ten survey lines, again depending on shoreline curvature.”
“We survey as many blocks as we can in a day, then bring that data back from the airplane. We can typically turn around a data product in a couple of days.”
The deliverables included:
- a classified LAS point cloud of both land topography and ocean bottom bathymetry,
- aerial photography from a medium-format digital camera, and
- hyperspectral imagery (“that product takes a little longer to deliver,” says Wozencraft).
“Since Hurricane Sandy, we have been comparing the pre-event data with the post-event data to produce a volume change product or an elevation difference map and computing volume changes on the beach and near shore,” says Wozencraft.
“We are doing that right now in Puerto Rico. Other applications of this data are computing volumes of debris and damage to buildings and roads.”
Starting with flight planning, “if they know the general area they want to survey, they can bring in their files in various formats, such as kml and shapefiles,” Smith explains. “Or, they can just draw their area of interest on our background satellite image. They output a flight path file of mission planning and give it to the operator on the plane. The pilot will see those pre-planned flight lines, and then the operator selects the lines he wants to fly.”
When the plane returns from the survey area, the surveyors import the raw data collected by the CZMIL into HydroFusion. By comparing the elevation images to those from the previous year, they can see where sediments have moved around, while the LAS files or the image files can reveal any new objects in the water.
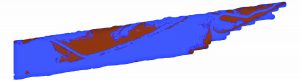
This land/water classification image of the Texas coast—land (brown) & water (blue)—was created by processing CZMIL lidar data with HydroFusion software. This image allows a quick look at potential changes in structure or land loss. Image courtesy of the Joint Airborne Technical Center of Expertise.
“They can use our Level 3 viewer and editor to view the entire data set in a 3D layout,” says Smith. “That allows them to mark points, such as objects that should not be there and probably got washed in there. They can mark them, then compare them with previous data.” Sometimes, the point cloud reveals something that might warrant a second pass.
Irma and Maria
The USACE used their CZMIL on behalf of the Federal Emergency Management Agency (FEMA) as part of emergency response efforts following Hurricane Irma in Florida and Hurricane Maria in Puerto Rico to assess changes in elevations above and below water.
The Florida survey took place from September 18 to October 25, 2017 along Florida’s East Coast, the Florida Keys, and Collier County. It generated a compressed file containing a point cloud of topography/bathymetry lidar data classified as valid non-ground topographic data, valid ground topographic data, or valid bathymetric data. Any misclassified points were manually edited.
USACE used specialized in-house and commercial software packages to process the native lidar data into 3-dimensional positions that can be imported into GIS software for visualization and further analysis. Data classified as ground points or bathymetric points in the las files were converted to a grid by generating a triangulated irregular network (TIN) and then extracting the grid node elevations from the TIN surface.
Additionally, the National Oceanographic and Atmospheric Administration (NOAA) used this lidar point data to produce topobathy bare earth digital elevation models (DEMs) at a 1 m grid spacing.
The Puerto Rico survey, which covered the main island as well as Culebra and Vieques, took place from July 3 to 17, 2018, as part of the Puerto Rico Shoreline Erosion Assessment Survey. It followed essentially the same process as the Florida survey.
The CZMIL topographic data was compiled to meet 1 m horizontal accuracy and 19.6 cm vertical accuracy, both at 95% confidence level. The CZMIL bathymetric data was compiled to meet 3.5 + 0.05 m horizontal accuracy at 95% confidence level, while the vertical accuracy depended on the depth.