By using fused data gathered with lidar and hyperspectral imaging, a geospatial services company helped a large utility to identify 90% of ash trees with the potential to fall into their power lines—in a timeframe that wouldn’t have been possible without the use of remote sensing.
By Ian Berdie, Zach Raymer, and Mia Chen
Remote-sensing technologies continue to be embraced at a growing rate. As the sensor technology used to collect geospatial data continues to improve, the cost curve to collect various types of data trends downward. New forcing functions like the Internet of Things and other technology-enablers such as 5G will add to the number of sensors collecting data at any given time, resulting in an era when geospatial data is becoming more and more ubiquitous.
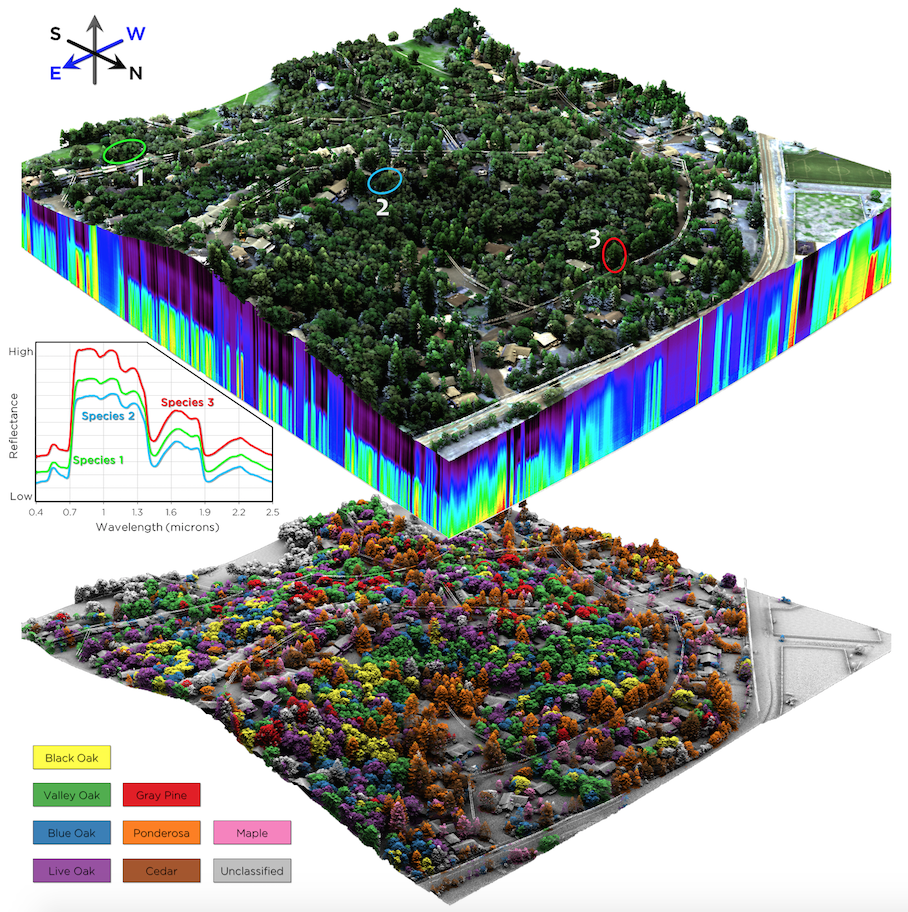
This image shows two examples of hyperspectral data or derived products used to colorize a lidar point cloud. At top, red, green, and blue color channels were extracted and applied to the point cloud. The call-out to the left shows the full reflectance spectrum from the hyperspectral data cube for the three labeled points. At bottom are the results of a tree species classification applied to a point cloud.
Despite an ever-growing amount of data, the value of any given data-stream will have limitations, but by finding synergy through the fusion of data, we have the opportunity to answer more complex questions than ever before.
Each piece of remote-sensing equipment has strengths and weaknesses. At its core, remote sensing is measuring and recording some physical property. Lidar uses light waves to measure distance, whereas radar uses radio waves. A wave buoy might use an accelerometer to measure changes in speed to describe wave heights, while a thermal sensor on a power-plant tracks temperature. While each of these sensors provides valuable data, the information obtained from the sensor is limited to the physical properties within which it was designed to work.
Real-world problems, however, are not isolated to a single domain but are instead influenced by a wide range of parameters. Consider this simple question: “How fast should I drive down this street?” The obvious answer is whatever the speed limit is. But, in reality, we know that the speed limit is not the only piece of data we use to inform us of how fast to drive. We also take into account traffic conditions, visibility, weather, and maybe what type of car we’re driving or who is in the vehicle with us.
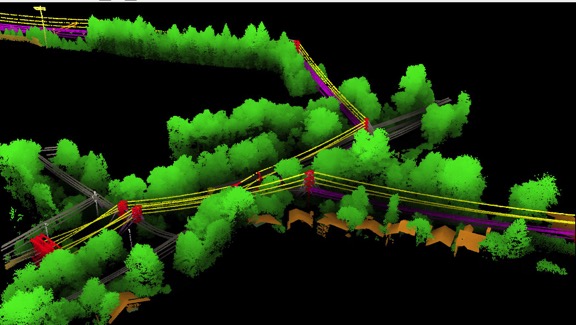
In this point cloud image of a neighborhood surrounded by powerlines, assets are classified for engineering design; data can be entered into a CAD for modeling and analysis.
So, how should one think about leveraging remote-sensing data, which is inherently limited to a single domain, to support decisions in a complex world?
In the example of a driver deciding how hard to step on the gas, their eyes and ears are the sensors, and their brain acts as a computer fusing all of those pieces of data together to inform their choices. Remote sensing is no different: in order to maximize the advances that have been made in sensor technology, with more and more data streams available to us, we are no longer limited to looking at the world through a single technology’s lens. But we must deploy the act of data fusion to extract maximum benefit. Let’s examine a real-world example to illustrate how this plays out.
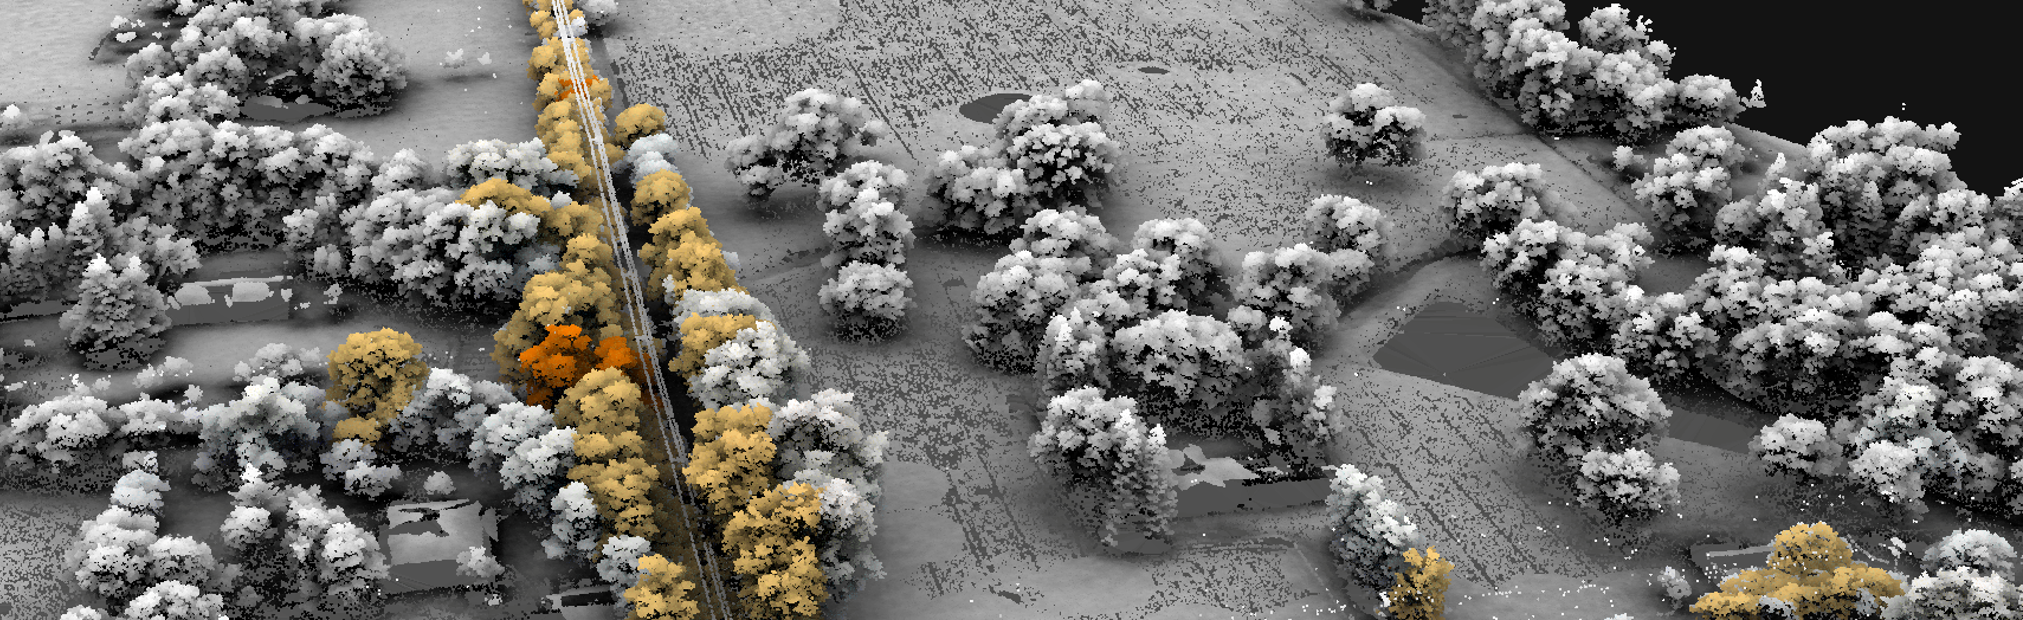
In a grove of ash trees, the darkest highlighted tree was identified from combined hyperspectral and lidar analysis as healthy, 55.36 ft high, 3.53 ft to wire, and with a 17.45 ft high overstrike. (Click to enlarge)
Vegetation Management
One well-adopted commercial application for remote sensing is for electrical utilities’ vegetation management programs. These groups are responsible for managing the risk vegetation poses to their infrastructure.
At a national level, this industry is regulated by a series of codes enforced by The North American Electric Reliability Corporation and the Federal Energy Regulatory Commission (NERC & FERC), as well as layers of state and local regulations and the utilities’ own best practices.
In that way, the outcomes are well defined and clear: don’t let vegetation impact critical infrastructure. The possible outcomes for any given tree are also relatively simple: trim the vegetation back, remove the tree, or leave it as is.
However, the factors influencing this simple decision for any given tree are multifaceted and complex. Of course, the proximity of the tree to the electrical conductor is important. But so is how quickly that tree may grow (a product of the tree’s species, proximity to water, soil, sunlight, etc.), how strong the wind is at that location, how much budget the utility has to do the work, whose property the tree is on, and the socio-political environment within which the utility operates. All of these factors influence the manager’s decision about any given situation.
To further complicate matters, utilities are not just trying to cross off regulatory check boxes; they are also trying to mitigate risk to their assets, customers, and communities. Much like deciding how fast to drive, in order to navigate these complicated ecosystems, we need to include multiple data streams and fuse those together in order to paint a detailed enough picture to make a management decision. What does that look like when we are talking about remote sensing data?
One Utility’s Problem
A great example of the power of data fusion can be found in some utilities’ response to the Emerald Ash Borer, an invasive beetle that has been spreading across North America. This small and destructive beetle species is fatal to ash trees, having killed hundreds of millions of ash trees in North America since it was first detected in 2002.
From a utilities’ vegetation management program perspective, a dead tree poses much greater risk than a living tree, as it has a higher likelihood of falling into infrastructure. Since mortality of infected ash trees can be near 100%, one large utility management company, in order to mitigate this risk, was motivated to identify and remove all ash trees across its system that had the potential to fall into their power lines.
Finding and removing only ash trees within thousands of miles of forest, and specifically only those ash trees that have the potential to strike power lines, poses a unique challenge that requires the intersection of two different technologies, hyperspectral imaging and lidar.
Hyperspectral imaging (HSI) is a form of spectral remote sensing, typically defined as measuring a wide spectrum of light (as opposed to just RGB and NIR). HSI has been around for some time, but until recently had been relegated to academic and government research.
The data have traditionally been collected by satellite platforms, with broad spatial resolution appropriate for landscape-scale analysis. The geospatial services company we work at, Quantum Spatial, has invested in high-spatial-resolution (0.5M pixel) and high-spectral-resolution (>325 channels) approaches to data acquisition, which has opened up new commercial use cases such as utility vegetation management.
Most hyperspectral sensors are characterized by high spectral resolution, which is the ability to record measurements along the electromagnetic spectrum in hundreds of channels. By analyzing reflectance of objects across these different wavelengths, it is possible to identify properties of objects not visible to the human eye and determine factors like soil minerality composition, vegetation health, or the utility’s problem: vegetation species.
HSI technology is limited to taking measurements in the electromagnetic spectrum and thus is unable to determine the proximity or fall-in risk any given tree may create. This is where lidar is leveraged.
Airborne lidar data has become an important tool for vegetation managers. Lidar provides the ability to accurately measure the distance from vegetation to conductor as well as accurately model which trees have the potential to fall into lines. Quantum Spatial is a major service provider for collecting and analyzing lidar data to support vegetation management programs. As such, processes for collecting, processing, and analyzing lidar data along 15,604 miles of transmission lines were well established by Quantum Spatial.
We also knew that lidar data alone was insufficient to fully address the problem. While lidar data would excel at identifying which trees could potentially fall into the power lines, the utility was only concerned about a subset of those trees that were ash. Only by fusing together data from the two technologies of lidar and HSI were we able to help them achieve a comprehensive view of the situation and make informed decisions about which trees to mitigate.
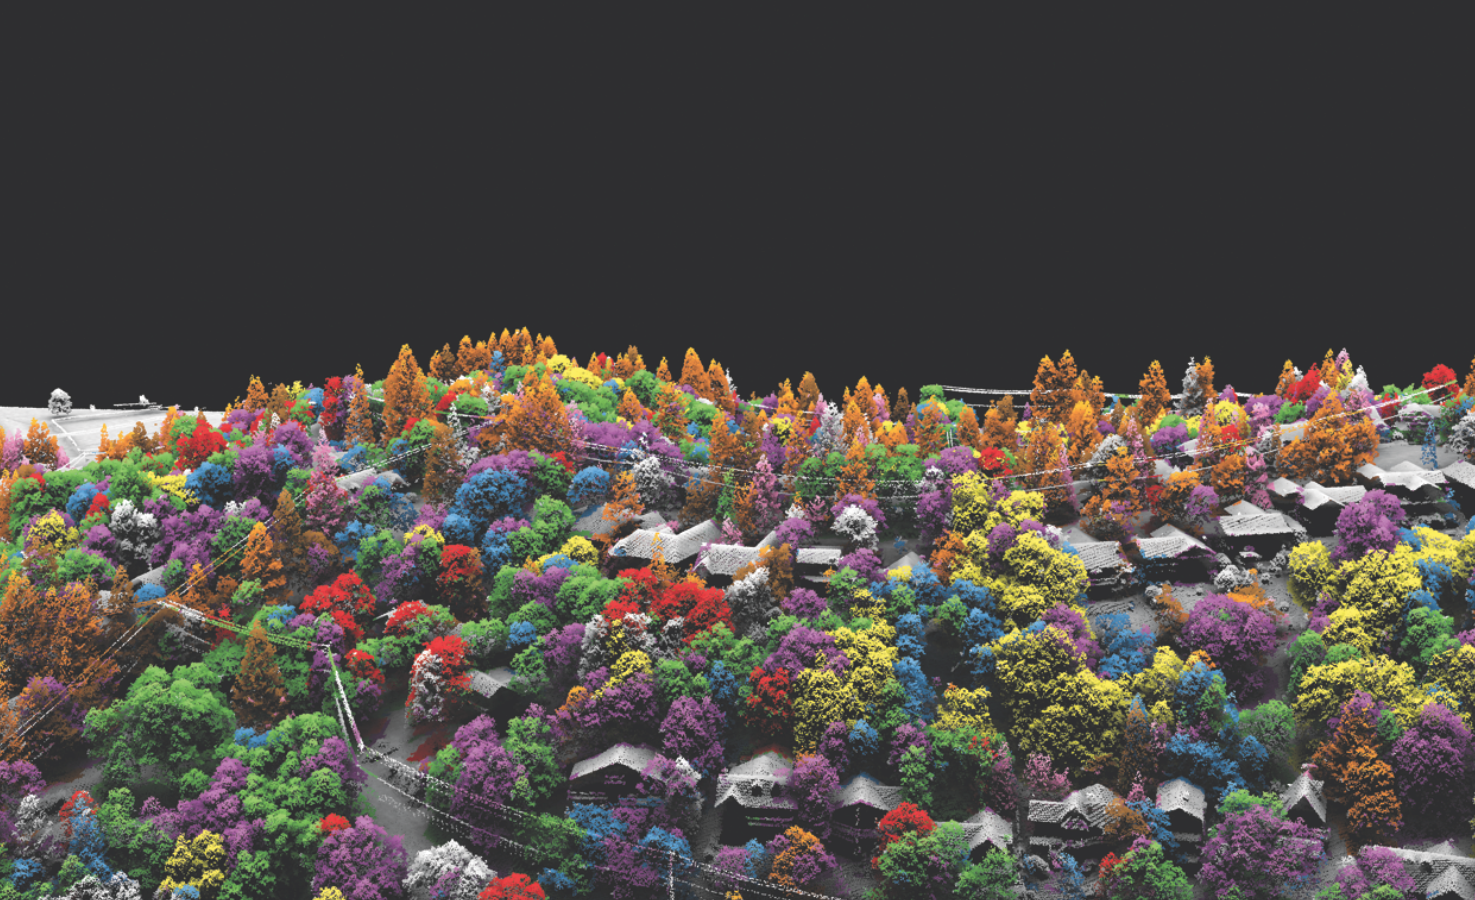
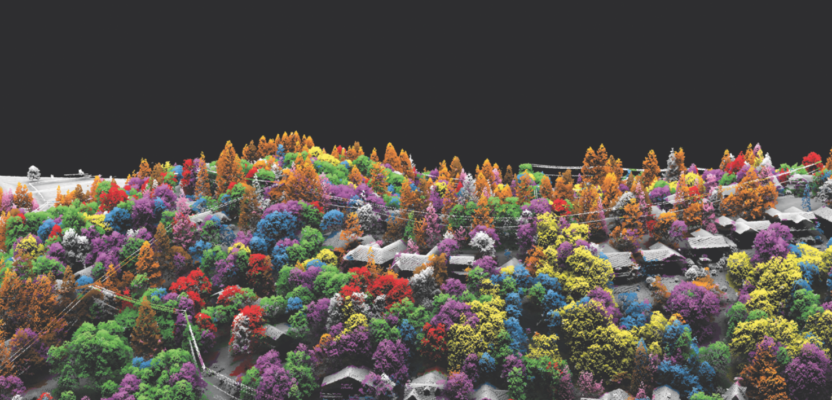
Species information was derived from hyperspectral imagery and then applied to the lidar point cloud for this image.
Data Fusion
Remote sensing applies data fusion at multiple scales. Data can be fused at a point or pixel scale by embedding attributes from one sensor (e.g. pixel) into the native data value from another sensor (e.g. point). Layering multiple data-sets into a single data-stack for analysis would be another example of this approach.
Fusion at the scale of a feature or object combines data from multiple sensors grouped by a commonality. An example of this would be grouping pixels and points into a tree crown or a building roof and treating the crown or roof as a single piece of information.
The final type of fusion deals with fusing the results of separate analyses to create decision logic that results in a more-informed analytics product. An example of this would be building models using different data sources and combining their results into a single decision function.
To solve the emerald ash borer problem for the utility, Quantum Spatial used a mix of all three of these approaches to data fusion to aid in our analysis of tree species and health.
We use lidar-derived digital elevation models to orthorectify the hyperspectral data, an example of fusion at the pixel scale. Compared to using a coarse resolution NED, using lidar helps minimize terrain distortion in the imagery and improves the positional accuracy of the spectral data. Not only is this approach more accurate, but it ensures spatial alignment between the two datasets, thus establishing the framework up for combined analysis.
Next, vegetation identified in the lidar point cloud is segmented into unique tree crowns, and polygons are algorithmically drawn around each unique tree canopy. This gives us the ability to extract data from the point cloud specific to each tree canopy, creating a distinct analysis zone for investigation.
Additionally, we use these polygons as a way of removing all non-vegetative pixels from the imagery before processing the hyperspectral data through our statistical transformation pipelines. In doing so, we leverage data fusion to isolate areas of analysis and help deal with computational challenges of performing this analysis across thousands of linear miles.
After fusing data for each tree-crown object, we are able to combine the data-sets to improve our analysis. Performing texture analysis, or sphericity analysis, on lidar point clouds can effectively classify coniferous trees, but not species. Spectral data are subject to the effects of atmospheric noise, and while this can be normalized out of a data-set, Quantum Spatial has found that calculating a set of lidar metrics unique to each tree crown that help describe the variation in physical structure for that tree, and adding those metrics to the hyperspectral data stack, improve our classification routines.
After the model is calibrated and assessed for accuracy, the results are attributed back to the tree canopy polygons and delivered to the client to take mitigative action.
At the end of this process we’ve performed both pure lidar analysis (to gain insight in proximity to power lines) and HSI analysis (to gain insight in tree species); Quantum Spatial is able to successfully identify ash trees that have the potential to strike the line. This proved to be less than 1% of the total trees on the utility’s system, greatly focusing the locations where they needed to take mitigative action.
Solving for Scale
For this project Quantum Spatial was tasked with collecting and analyzing data over 2,736 linear miles of HSI data, one of the largest commercial HSI projects ever undertaken at this resolution (0.5M pixels). As an important part of the utility’s ability to maintain a safe and reliable electric grid in the face of expanding zones of ash tree mortality, the ability to process and analyze the 100 TB of data on a rapid timeline was of utmost importance.
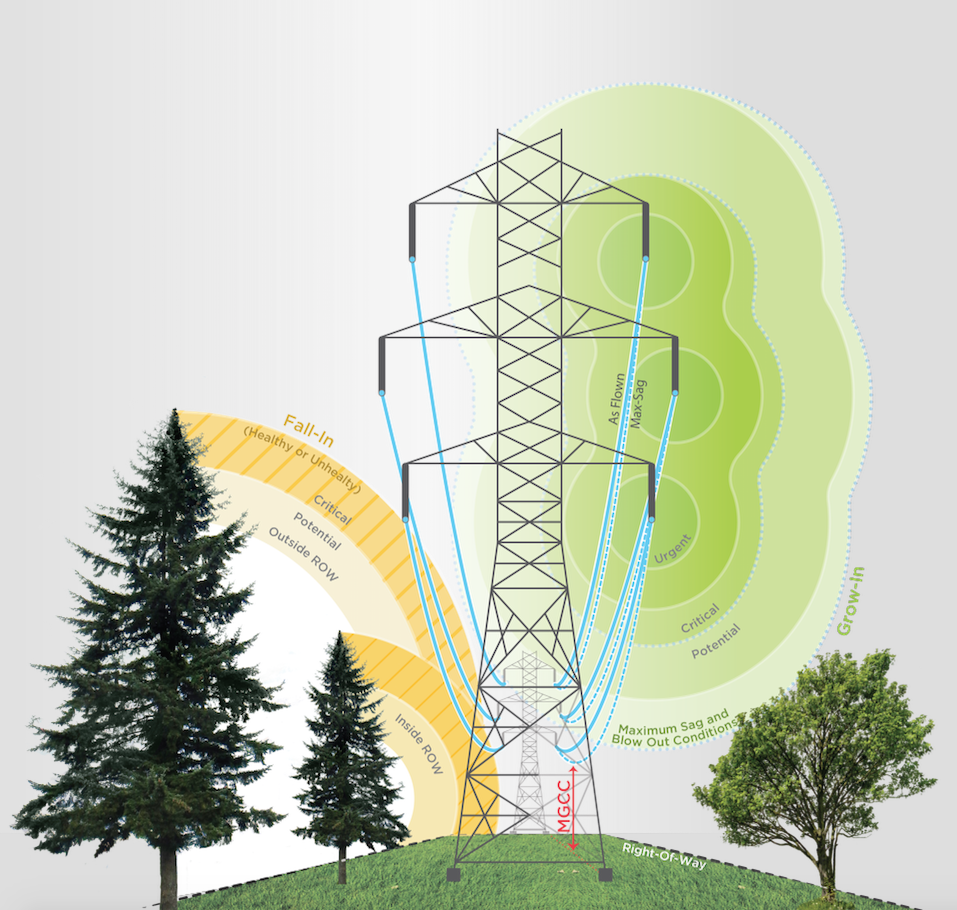
By fusing lidar data with ambient weather data, line-load, and other engineering information from the utility, Quantum Spatial is able to model conductor positions under different conditions to better describe the risk any given tree may pose to the infrastructure.
To improve processing times, Quantum Spatial has moved all of its analysis away from commercial off-the-shelf software and into an open-source, primarily python-based, code library. This has provided significant increases in processing speed as well as allowing for a more flexible analysis workflow. Depending on the type of analysis, we have seen increases from 50x to 1000x in the amount of time it takes to analyze a hyperspectral datacube, turning what used to take weeks into hours.
Additionally, Quantum Spatial has leveraged on-premise distributed computing infrastructure that allows analysts to process large swaths of data simultaneously. Currently, we are working to deploy this workflow to the cloud. We hope this will further eliminate the squeeze that high-volume hyperspectral data puts on network storage drives as well as leverage the scalable nature of cloud computing.
New sensor technologies allowed us to acquire data in a way that wouldn’t have been possible just a few years ago. By fusing these data together in innovative ways we were able to take concepts vetted by the scientific community and turn them into applied science to deliver meaningful results. In this case, this meant finding 90% of ash trees on their system in a timeframe that wouldn’t have been possible without the use of remote sensing. Fusing the two technologies of lidar and hyperspectral imaging together ended up being the easiest solution to the problem. Almost as easy as driving a car.