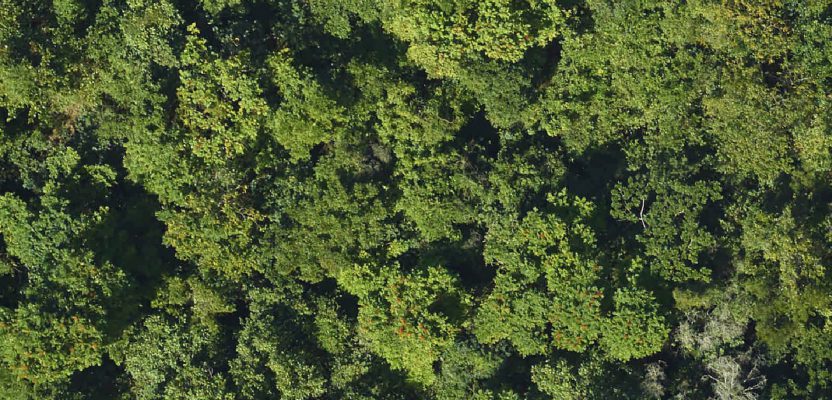
Above: The forests of Puerto Rico are second-growth, making for useful modeling.
After hurricane deforestation in Puerto Rico, NASA scientists study forest regrowth using high-resolution, multi-sensor image data.
The Biospheric Laboratory of the NASA Goddard Space Flight Center is dedicated to increasing knowledge about the Earth’s terrestrial ecosystem. One group of scientists there has been studying rates of forest regrowth following harvesting or natural disasters. These forest regrowth rates depend on local factors such as climate, elevation, and soil types.
By collecting ground and remotely sensed observations across a gradient of factors, researchers can begin to determine whether tropical forests will continue to be a significant carbon sink in the future.
The Island of Puerto Rico makes an interesting research area for forest recovery modeling, as it was completely deforested during the middle part of the 20th century. The forest that is now present in Puerto Rico is a regrown, second-growth forest. The geography of the island is diverse, as there are many differences in soil types, elevation, and climates.
During 2017, a project funded by the U.S. Department of Energy was initiated to study tropical forest regrowth rates. Additionally, ecologists were interested in the role of tropical forests in terms of sequestering carbon. The project consisted of forest data acquisition through airborne lidar and image data, as well as ground measurements and terrestrial lidar scanning.
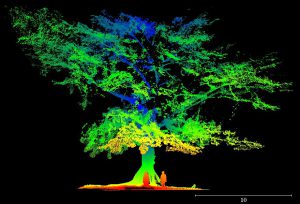
A 3D lidar image of an African tulip tree, mapped as a highly identifiable tree and fast re-growth colonizer.
The African Tulip Tree
Spathodea campanulata, or African tulip tree, is a non-native tree species with orange-colored flowers that occupies much of the island. It is an effective colonizer following disturbance and abandonment of agricultural land. The researchers were interested in producing maps of the island that showed where the tree can be found and how much forest canopy volume it represents.
NASA scientist Dr. Ian Paynter explained that the motivation for this study is to “use a highly identifiable species to understand the ecological significance of the colonization of particular regions over others, after a major disturbance such as the 2017 hurricanes. The resulting expansion of the African tulip tree is controlled by the varying levels of hurricane damage and other underlying factors such as land-use history and soil type.”
In order to produce this African tulip map, both aerial and terrestrial data were collected. For this project, scientists chose to use a combination of airborne lidar and optical image data to characterize the tree canopy, while ground observations and a terrestrial laser scanner were used for calibration and validation. The project data is available for download from NASA through a web data portal.
Approximately 50 flight hours were carried out over a week during 2017, which resulted in 20 terabytes of raw data. The same areas were reflown during 2018, following hurricanes Irma and Maria. An interactive map available on the G-LiHT (see below) website allows users to view and download data. Transects were flown across the island to cross ecological, environmental, and elevation gradients.
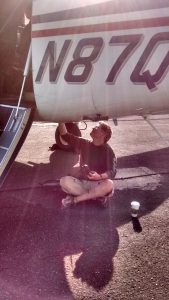
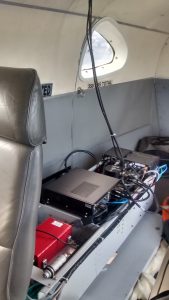
Dr. Bruce Cook checks the G-LiHT instrument port underneath the aircraft in Puerto Rico.
G-LiHT
The flights were carried out using an instrument package called G-LiHT, which stands for Goddard’s Lidar, Hyperspectral and Thermal airborne imager. It consists of two scanning lidars; a Phase One Industrial aerial camera; a Hyperspec VNIR imaging spectrometer; a fine-resolution red-edge imaging spectrometer; VNIR and red-edge solar irradiance spectrometers; a thermal infrared camera; and a precision GPS-INS. These components are all commercially available instruments that provide the stability and reliability needed to take measurements on a daily basis over a long time period.
G-LiHT is a portable, airborne imaging system that simultaneously maps the composition, structure, and function of terrestrial ecosystems using lidar, imaging spectroscopy, and thermal instruments, which enables data-fusion studies by providing coincident data in time and space and provides fine-scale (<1 m) observations over the large areas that are needed in many ecosystem studies.
G-LiHT uses lidar to provide 3D information about the spatial distribution of canopy elements, VNIR (visible to near infrared) imaging spectroscopy to discern species composition, and variations in biophysical variables and thermal measurements to delineate wetlands and to detect heat and moisture stress in vegetation.
Dr. Bruce Cook from NASA explains why a combination of several different sensors were used: “Each sensor provides a little bit of different information and context for the things we’re interested in, such as species, cover of forest vegetation, their health and productivity. We can better characterize forest ecosystems with multiple sensors as opposed to one killer sensor that does everything. For example, we merged fine-resolution imagery from the Phase One camera with lidar data to quantify forest canopy volume that is occupied by Spathodea.”
Aerial Camera
The Phase One aerial camera offers a 100MP resolution, with a cross-track coverage of 11,608 pixels. It is equipped with CMOS sensors enabling very short exposure time of up to 1/2000 sec. Its high noise resistance feature is effective at low light.
The G-LiHT system acquired data for 250 hours in 2017, covering 11 U.S. states.
For this project, the Phase One camera was used to produce RGB photographs for identification of fine-scale canopy features. The camera provided the opportunity to develop new algorithmic approaches that can handle large volumes of high-resolution imagery.
Additionally, the G-LiHT system uses a Riegl airborne laser scanner often used for large-scale mapping. For this project the researchers flew relatively low, which enabled the team to capture data from under the clouds and to obtain as much detail as possible about the ecosystems that were monitored. The airborne data was captured during the dry season when conditions were supposed to be most favorable, meaning clear skies and no precipitation.
One of the most valuable fusions of data turned out to be the lidar returns in combination with the fine-resolution aerial imagery, says Cook. “The Phase One imagery enabled identification of the individual Spathodea flowers, whereas the lidar data enabled the quantification of the tree volume. Combining both data sources made it possible to look for individual flowers as we flew over them at 200 mph.”
The airborne data had a finer resolution than satellite imagery of the same area so that observations on the ground could be scaled to airborne and satellite data. Moderate- and coarse-resolution satellite data provides a wide-area coverage at greater temporal frequency, but often with less spatial detail.
Developing a Classification Algorithm
The aerial camera resulted in large data volumes, exceeding those of any of the other instruments used for the project. In order to be able to analyze all of the data and see where the Spathodea trees are located, NASA developed a classification algorithm that would automate locating the orange flowers in the aerial imagery. This was possible due to the fact that the camera produced fine-resolution images (~3 cm) where individual flowers could be found in thousands of pixels. This eliminated the need to unmix spectral information contained in coarser-resolution hyperspectral data.
Terrestrial Scanning
The researchers took measurements on the ground to get a better view of what’s present there and to deal with edge cases that are found in the aerial imagery.
Ground observations provide critical calibration and validation data for every NASA campaign, says Cook. “When you’re collecting observations from an aircraft, you can measure the size of a canopy, but you can’t really determine what’s underneath that canopy or how big a stem or trunk volume is. Those are really best measured on the ground. Also, structural data from airborne and terrestrial lidar can be combined to obtain a more complete view of individual trees.”
The final classification algorithm NASA developed was able to identify flowers under different environmental conditions and enabled the researchers to perform their analysis over landscape- and regional-scales.
Classifying Forest Conditions
Digitized high-resolution aerial imagery and classification techniques open up new territory for NASA, says Cook. “Identifying trees that may be in decline is important for forest health studies. This project has been an excellent testbed for making tools for detecting insect and disease outbreaks. Being able to characterize forest health conditions over large areas is important for ecosystem monitoring.”
Post-hurricane Work
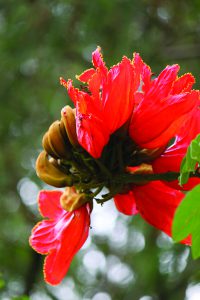
The African tulip tree flower.
When hurricanes Irma and Maria hit Puerto Rico during 2017, the NASA project took a different turn. An emergency situation followed where many people were left without shelter or electricity and with damaged roads and bridges and a shortage of food, healthcare, and fuel.
When the research continued five months later, the same areas were reflown to evaluate the devastating effects of the massive storms on Puerto Rico’s ecosystems, as well as the forest’s gradual recovery.
Dr. Ian Paynter says, “What interested us is finding out where there was more resilience in the landscape, what tree species were most impacted, and what’s going to grow back in the future.”
In additions to aerial data capture, terrestrial laser scanning provided further insights. For example, the understory of the forests had also changed a lot because of the hurricanes. However, accessibility of certain sites proved to be an issue due to damage to the infrastructure on the island.
“The terrestrial laser scanning sites were difficult to access post-hurricane due to fallen trees and landslides. In the terrestrial laser scanning data, we observed a great deal of canopy defoliation, branch loss, and a higher rate of tree mortality than you would normally see,” says Paynter.
There is still work to be done assessing the magnitude and extent of post-hurricane damage. Cook says, “Immediately following the hurricanes we were able to assess mortality and loss of canopy foliage, but future monitoring will be needed to determine the long-term survival of individual trees.
While some trees may still have leaves, there may not be enough canopy remaining to ensure their survival. We have to wait and see if some of those trees that were damaged and lost branches or leaves will survive in the future. Some of what happened as the result of the hurricane won’t be manifest on the landscape until decades from now.”