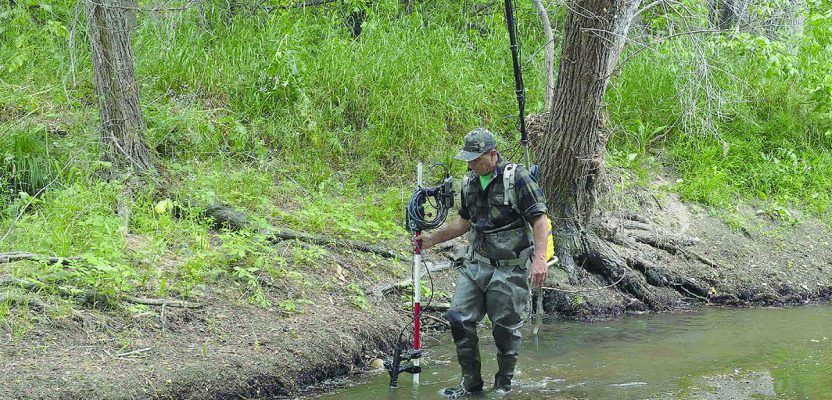
Above: Martin Offenhauer surveys the Big Rock Road section of the San Diego River. Credit: SDRPF.
Mapping rivers above and below the surface creates great opportunity for engineers and stewards.
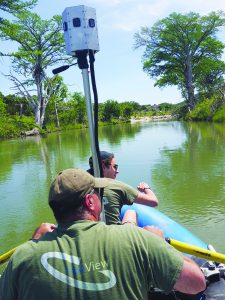
Scanning the Blanco River in Texas after the historic Memorial Day Flood.
The way maps are produced and displayed varies greatly, depending on their extent, their intended use, and the peculiar challenges of each environment.
Mapping a small river is hard to do from the air because vegetation often obstructs the line of sight; helicopter time is very expensive; and small UAVs quickly run out of battery power, cannot carry bathymetric lidar, and, if flown low enough to see beneath tree branches, are constantly at risk of running into them. Therefore, the task is best accomplished from a boat or even by wading in the water.
Additionally, water-resource managers often need much more data than just the contours of a river’s banks and the bathymetry of its bottom. They also need data about such things as water quality (turbidity, pH, electrical conductivity, salinity, dissolved oxygen content, ammonia, etc.), temperature and thermocline, and surface debris.
Because large portions of many rivers are in remote areas and hidden from view by vegetation and topography, virtual 3D tours can help engineers develop river preservation and restoration projects and the rivers’ stewards—whether government agencies or private nonprofits—generate public support for these projects.
FishViews, a start-up based in Wimberley, Texas, has developed a kit to map rivers and software to display the georeferenced imagery in 3D with underwater images and associated water-quality data. The company sells or leases this equipment or collects the data directly, then processes the data, produces virtual river tours, and posts them on its website. The San Diego River Park Foundation (SDRPF) bought one of these kits and is using it to map the San Diego River.
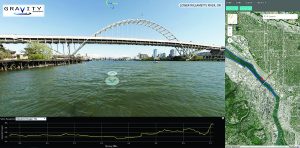
A view of the Williamette River, in Portland, Oregon, captured with FishViews.
Origins
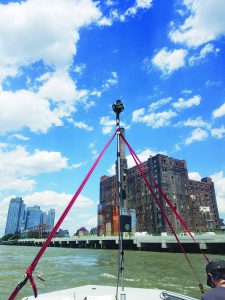
Part of a pilot project with Riverkeeper is mapping water quality and shoreline of the East Channel in New York Harbor. Credit: FishViews.
Brian Footen, a fisheries scientist, co-founded FishViews with a close friend who was an Air Force jet fighter pilot. They first tried to use a small UAV to count salmon nests, called reds, which had traditionally been done using helicopters.
They soon found that UAVs were not a good tool for this type of collection due to their short battery life, the difficulties of navigating between tree branches and water, and, most of all, the attitude at the time of the Federal Aviation Administration, which “was dragging its feet on any regulation for the commercial use of drones,” Footen recalls.
However, Footen realized that the high-definition imagery that they had been able to capture contained much more information than can be obtained from Google Earth (or Google Maps) aerial imagery, so he explored the concept further.
One day, zooming in to Google Maps imagery of a river to compare it with his UAV imagery, he accidentally ended up in Street View due to a road along the shore and realized, “We need Street View for rivers!” He brought on board a couple of computer programmers, then talked to angel investors who told him that, if he and his team could prove that it was feasible, they would invest in the project.
“So, we went out for the next year and a half and built the tech and the software application that drives the imagery, talked to colleagues about the tools that they wanted in a software application for using imagery with their data, and built what you see today,” he recalls.
Business Model
Currently, FishViews is operating mostly as a consulting firm, seeking contracts with federal, state, and local water-resource managers to map rivers. Footen’s title is president, environmental science.
However, the company also builds a turn-key solution that it can lease or sell to end users. On a sunny day in July, Footen joined Andrew Meyer, SDRPF’s field coordinator, and a group of SDRPF volunteers on the river to help them use the equipment.
“They are part of our You Map It program,” he says. “They collect the data and send it to us. We process it, host it on the cloud, and put it in our software application for them. It is all publicly available at FishViews.com.”
The company is also looking to crowd-source a lot of content with smaller equipment, such as off-the-shelf 360-degree cameras that it customizes in order to build a library of content that people can import into their own maps and applications.
Refresh Rate
In some cases, a river needs to be mapped periodically or before and after a major change. For example, a few years ago the National Park Service hired FishViews to map the South Fork of the Hoh River and the Elwha River, both in the Olympic National Park, just before the dams there were removed. It then hired the company again this summer to re-map the Elwha River.
The company is also pursuing continuous mapping using crowd-sourced imagery from cameras on commercial vessels, such as tugboats, fishing boats, and whitewater rafting guide boats.
Hardware and Software
FishViews uses customized versions of commercial off-the-shelf instruments, including a 360-degree camera, a water-quality meter, a depth finder, an underwater camera, and an inertial measurement unit that collects yaw, pitch, and roll with a 1m/s accuracy. All these instrument measurements are logged simultaneously every five seconds on data-logging hardware that the company built.
For post-processing, the company stitches the pictures together to create about 250 panoramic scenes per mile. It then hosts these scenes online and serves them up in its customized software, which uses data visualization tools and an ArcGIS online map to locate the imagery and other data relevant to the panoramic scenes.
Data
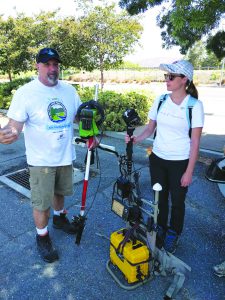
Brian Footen explains the working of the FishViews equipment to a group of San Diego River Park Foundation volunteers. Credit: Matteo Luccio.
Buying a “full kit” from FishViews or hiring the company to map a stretch of river yields a comprehensive baseline of what is going on in the river, including georeferenced measurements of water quality and depth. The imagery reveals, among other things, the amount of wood in a river, the number and depth of pools, and the conditions of the banks and the sediments.
Using traditional methods, Footen says, it took two three-person crews seven days to map 20 miles of the Snoqualmie River, while a single team from his company was able to perform the same work in just one day.
“We scanned the river with our gear, processed the imagery in two days, and gave it to them,” Footen recalls. “One of their guys used the same method on the imagery that they use in the field to quantify the habitat. It took him a couple of days to go through the imagery, as opposed to being out in the field for a week.”
While the river’s managers were not able to use the data to measure a log to the nearest centimeter, they were able to sample the pieces of wood and bin them into different size categories, which was enough for their purposes. “It was a really great discovery for them.”
Visualization Tool
FishViews has developed a visualization tool that displays the imagery longitudinally, by survey mile, as well as data on dissolved oxygen, conductivity, temperature, total dissolved solids, pressure, resistivity, and salinity. By moving the cursor along a chart, users can move to any spot on the river.
Using this tool, Footen discovered that the max depths recorded in the river, which show up as spikes on the chart, coincide with sharp turns against rip-rap bank stabilization projects.
“The river is hitting that rock and scouring a deep hole and then moving on. So, all the biggest holes in the river were the result of, basically, bank erosion protection projects.”
Mapping the San Diego River
SDRPF—whose mission is to create a better future for the historic San Diego River through engagement, meaningful actions, education, and advocacy—is using FishViews to map the river and create a virtual tour of it. It hopes that this will engage the community and promote stewardship of the river, encourage more people to get out and see the real thing, and inspire citizen science.
“Engaging our community with a ‘River View’ of the San Diego River will help people to plan hikes, rides, and walks, encourage people to go to new places, and remind people of why the river is so important and that they have a role in caring for it,” says Meyer.
The foundation, which began the project in June, in four months had mapped 10 miles of the river or about 20%.
“We are taking into account the river’s seasonality, though, waiting for the upstream portions of the river to be flowing before we map them,” says Meyer. “We’ll kick the project into high gear once the winter, rainier season starts. Our plan is to be done in about a year.”
The San Diego River has lush riverbanks in many places, which makes for slow progress. Nevertheless, collecting the data has not been too difficult. The river also has very interesting bathymetry, Meyer points out, perhaps due to the history of sand mining in the floodplain and river bed.
“Some stretches have shallow riffles followed by very deep pools—which makes for wet waders some days!”
Conversely, during the summer months, parts of the river bed can be dry.
A view of the Walker Preserve from the San Diego River. Credit: SDRPF.
Discovery Center
The foundation plans to map the river once, then add some of the key tributaries. Because it owns the FishViews gear, it is thinking about ways to incorporate updated maps and images into its annual work plan.
In mid-September, the foundation sent 10 miles of river data to FishViews for processing into a tour. By sharing it with the community, including the ability to look at it through VR goggles, it hopes to get yet more people involved in collecting the data.
Eventually, it plans to build a Discovery Center where visitors will be able to take virtual tours of the river on a large video screen, and it plans to share the data with classrooms, either directly or with distant learning programs and partnerships.
Gateway to Engagement
Many portions of the San Diego River are remote, and, therefore, few people have seen them.
“Ultimately, we would like to get an entire community of citizen scientists and stewards to be engaged in caring for and watching over the entire river,” says Meyer.
FishViews is “an incredible tool to advance our mission of connecting more people with this often-overlooked resource,” says Rob Hutsel, SDRPF’s president and CEO. “We are excited to utilize FishViews to inspire people to get outdoors. After first getting them to use the technology for a VR experience, we hope they will want to get a taste of the ‘real thing.’ If people get outdoors and enjoy nature, we can’t help but get more folks to be passionate about caring for and protecting it.”