A surveyor tests software solutions from an innovative Canadian firm for managing, processing, navigating in, and visualizing large 3D data sets.
When do you have enough software? Is it when you’ve finally reached the ability to perform a software program’s base use that drove you to purchase it in the first place? Or is it when you’re grasping at straws attempting to cure a seemingly unsurmountable problem? Is there ever enough?
For most of us in the geospatial engineering/land surveying field, the rate at which software has evolved can hardly be matched by training and general end-user knowledge.
In our geospatial endeavors, we’re a profession and industry with deep roots in the past (although I foresee a change coming). Our work makes us look back on a daily basis through our research of field notes and the retracement of our predecessor’s footsteps. Yet our clients increasingly require us to help them look into the future: to provide 3D modeling, BIM, and as-builts for continuous representations of reality that can be readily viewed and used through all phases of design and construction—and this is fairly tech-centric.
Technology has been a bane to our industry as a lot of us are slow to change our ways because we do not trust things we can’t see to quantify. We have grown to trust tech through differential and repetitive analysis, but, for example, GNSS vector processing still worries many in our industry as they don’t know exactly what the processing software is doing behind the scenes.
The concern has increased as files continue to grow, forcing the user to buy more and better hardware (video cards, RAM, GPUs) in order to visualize the data.
Faster without Visualization
That’s where point-cloud processing solutions like Solv3D’s 3DPointLogic come in to play. Solv3D is Canadian firm based in Calgary with deep roots in geomatics research and surveying and engineering.
With this system, the user is able to load up each of the scan data files and run routines against them with a great improvement in speed, as the software is simply focusing on the data files themselves and running selected processing features against them.
Without the need to directly visualize the data during processing, you’re saving yourself a lot of the time that would have been wasted on waiting for the point cloud to load. You may feel like you’re missing an important step, but for a lot of things visualization is unnecessary.
For instance, re-projecting a point cloud is not something that needs to be viewed or user-manipulated in any fashion. Rather, the user just needs the file translated from one projection to another. With software like this, you can direct the program to the point cloud data set and choose the routines that you would like to run against it. From there, 3DPointLogic will run the routine and deliver the new file. This whole process is much faster than the more conventional method of loading and opening each file, then performing your desired tasks.
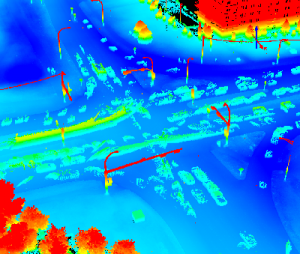
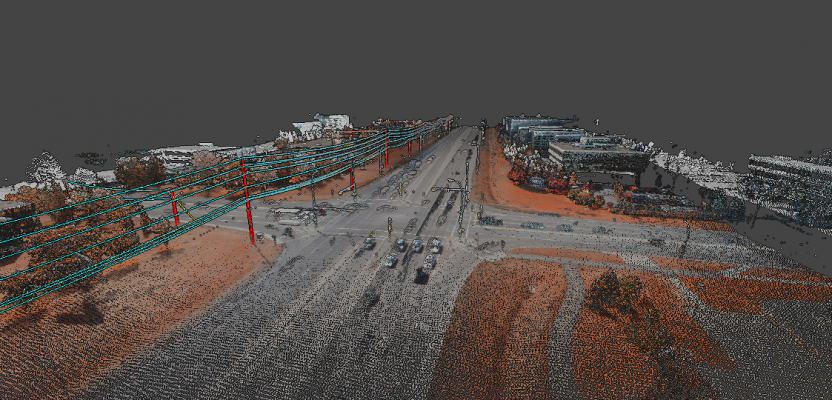
A point cloud before noise removal.
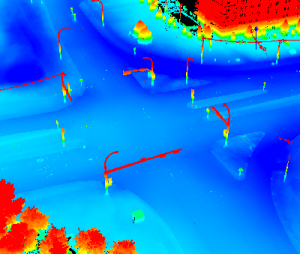
A point cloud after noise removal.
Building on that system is where 3DPointLogic takes another step forward. Within that platform the user has the ability to create and save multi- step routines with the same efficiency.
For example, let’s say you’ve just finished scanning and registering your scans of a one-mile stretch of roadway. You then notice that you need to make a few changes to meet certain specifications based on your client’s needs.
You would direct this software to look at those registered PTS point cloud files and create the following routine to run against them:
- combine all of the original files,
- convert the new file from meters to U.S. survey feet,
- classify the ground data,
- filter out all of the noise, and
- cut the singular scan file into five equal-sized tiles.
Once you have laid that process out, begin the routine and the software will start working its way through the workflows you selected. You will end up with five tiles that are now in U.S. survey feet with the noise removed and the ground classified, ready for production or delivery.
The routines that you make can also be saved for future use. This is helpful if you’re working for different clients each with different delivery needs.
In the process of testing this system, I came across another benefit: it is much more stable, especially with larger point cloud files, than most other platforms. When I was processing my data, it seemed the 3DPointLogic did not care how large the files were as it seems to just be going through the file line by line, a process that other systems don’t follow as they try to load the whole thing at once to process and display files.
This is not to say that your system requirements are not a factor. Storage and processing power are still very much relevant, but the fact that your system is not using much of its horsepower to visualize the file seems to make quite the difference.
There are also many different routines that you can choose from, and the list appears to be growing all the time as new algorithms are developed. I will not get into what they have available at this time as there are too many to list. With that being said, they do offer a 30-day trial of this system on their website, and that’s the best way for you to see what this package can do for your workflow.
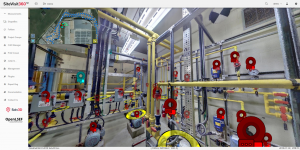
You can tag assets within a synthesized photo.
Cloud Viewing
Solv3D is tackling another innovative software system that’s worth looking at while you’re on their site. SiteVisit360 is an immersive point cloud/scanning/viewing system that operates solely within a web browser so that it’s accessible by anyone with an internet connection.
Again, this isn’t the only system to achieve this; however, when experienced live, their SiteVisit360 system is one of the most user-friendly and intuitive systems that I have come across. The user-friendliness of this viewer is a big achievement in itself as it would be great to give end-users or clients access to our very large point cloud files that would be typically reserved for only our offices. Here, you have a way to engage end-users and get them even more excited about your projects, as now they can see them in a way that feels more like Google Earth or Street View.
You also get the ability to add 360° panoramic images, CADD files, and other shapefiles so that you can overlay all of the data and get an immersive feel for the project. Basic measurement tools are also available within the platform and can be exported out.
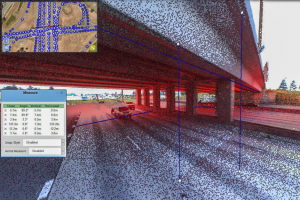
Performing clearance measurements under a bridge with a point cloud on top of 360° panoramic imagery.
Getting this information out to our clients and those who may not be directly a part of our projects is becoming more and more of a necessity. It adds another layer of value to the data that otherwise would remain in a bit of a black box as far as those outside the direct path of the project may be aware.
Ultimately, pushing our digital work out to the masses forms an experience and reveals these technologies to a broader audience. This will likely help us sell even more of these services, creating a snowball effect.
In these days of fast-paced technological growth, it’s important to keep in mind that there is a lot of mapping outside the umbrellas of the big players in our industry, and many of these “boutique” software providers like Solv3D are often pushing innovation even farther.