There is no hiding it: I’ve been building a lot of 3D data recently, partly to sell, partly to fuel my adventures into augmented reality (if you’re interested in me adding this to the blog, please say!). The main vital thing has been the heightmap.
Providing Certainty in 3D Heights
What is a heightmap, you might ask? Well, it can be called several names, but I use this term to describe a raster that contains the relative heights necessary to extrude and height features in the third dimension.
Of course, there are many ways of injecting height information into your data, from the conversion tools for lidar (that creates heighted footprints directly from the point cloud) to deriving data from the DSM. But, the reason I create a height map is so that I can extract other features, and it’s been a method I’ve used for years as it provides certainty in the heights no matter what the datum.

DSM – DTM = Heightmap
The heightmap is essentially the heights derived from taking the values in your Digital Surface Model (DSM) away from your Digital Terrain Model (DTM). It is a little counter-intuitive, as normally a DTM is derived from the original DSM.
I could go into loads of nerdy detail, but there are many tools within both the survey software and GIS to do this.
Knowing this and provided your DSM & DTM are from the same capture date (datum and cell size are similar), you can simply take one raster from the other (DSM from DTM), and the resulting raster will be relative heights.

The raw heightmap

Colored so that you can see it better. Pixel value is the height.
Avoiding Datum Issues
Why not extract the heights from the DSM? (It would be easier to just extract the heights on the DSM using footprints—using an algorithm that provides the height where the two intersect.) The simple answer to why not is to avoid datum issues. You see, if I height the data based on the DSM, then the height for the object would be relative to the datum of the DSM. If I chose to use another datum (based on the same units of height), the heights would be wrong.
For me, this is a huge issue as I want to create 3D data that can be used on several platforms; the heights of the data would be wrong when basing heights on the DSM. Using the heightmap method means that the height of the features aren’t tied to a datum, and the heights extracted can be used relative to any terrain/surface (using the same units of vertical measure).
Creating a Heighmap
Hopefully, you are still reading this and haven’t fallen asleep due to my incessant push for the heightmap. Let’s have a look at creating one using the open-source Environment Agency composite lidar.
- Go to HERE
- Download the 1m Composite DSM and the 1m composite DTM (ensure you get matching tiles!)
- Choose your GIS weapon of choice and open the “Raster Math.” Note that this is free in QGIS and GRASS, but you will require the Spatial Analyst or 3D Analyst plugins (at cost) for Esri software.
- Use the raster math to “minus” the DSM from the DTM and export the result as GeoTiff.
- You now have a heightmap!

The rather awesome EA lidar portal.
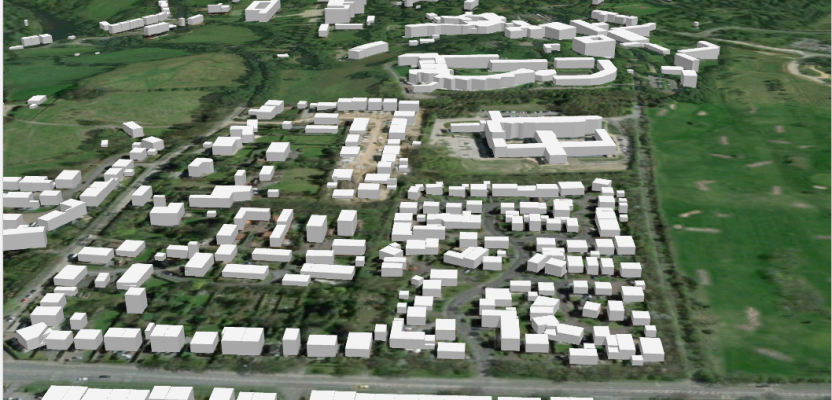
With this new shiny heightmap you can use the point sampling tool in QGIS to get height values into your attribute table of your footprints, or in Esri software you will want to use the “Interpolate Shape” function. Either way, the result is a shiny 3D data for you2 chosen 2.5D, 3D, or 4D software, something like the one I made below.

Resulting 3D buildings
For more on how to do 3D from dragons8mycat, click the articles below:
- Add 3D Tiles to Cesium 1.36 to Make 3D Virtual Scenes
- Nick’s 3-part series on web mapping
- Morphing Landscapes
Or just click on Spatial IT in our Channels drop-down menu, above.