Static 3D models of topography and buildings are commonplace in both technical and popular geospatial software. There are still very few 3D tools, however, that enable users to geo-visualize dynamic phenomena, such as the effects of climate change.
One such tool called CLIVE, for Coastal Impact Visualization Environment, displays change due to oceanic thermal expansion and consequent coastal erosion. It was co-developed by Nick Hedley, a professor at Simon Fraser University and the director of its Spatial Interface Research Laboratory, and Adam Fenech, a professor at the University of Prince Edward Island (UPEI) and the director of its Climate Research Laboratory.
By combining their expertise, Hedley and Fenech and two of their students created this tool to be accurate yet also easy to use by people with little or no geospatial training. “There’s a real balance of expertise,” says Hedley. “We bring the geo-visual, analytical interface intelligence, and he brings the long-term climate science expertise to the table.”
Capabilities
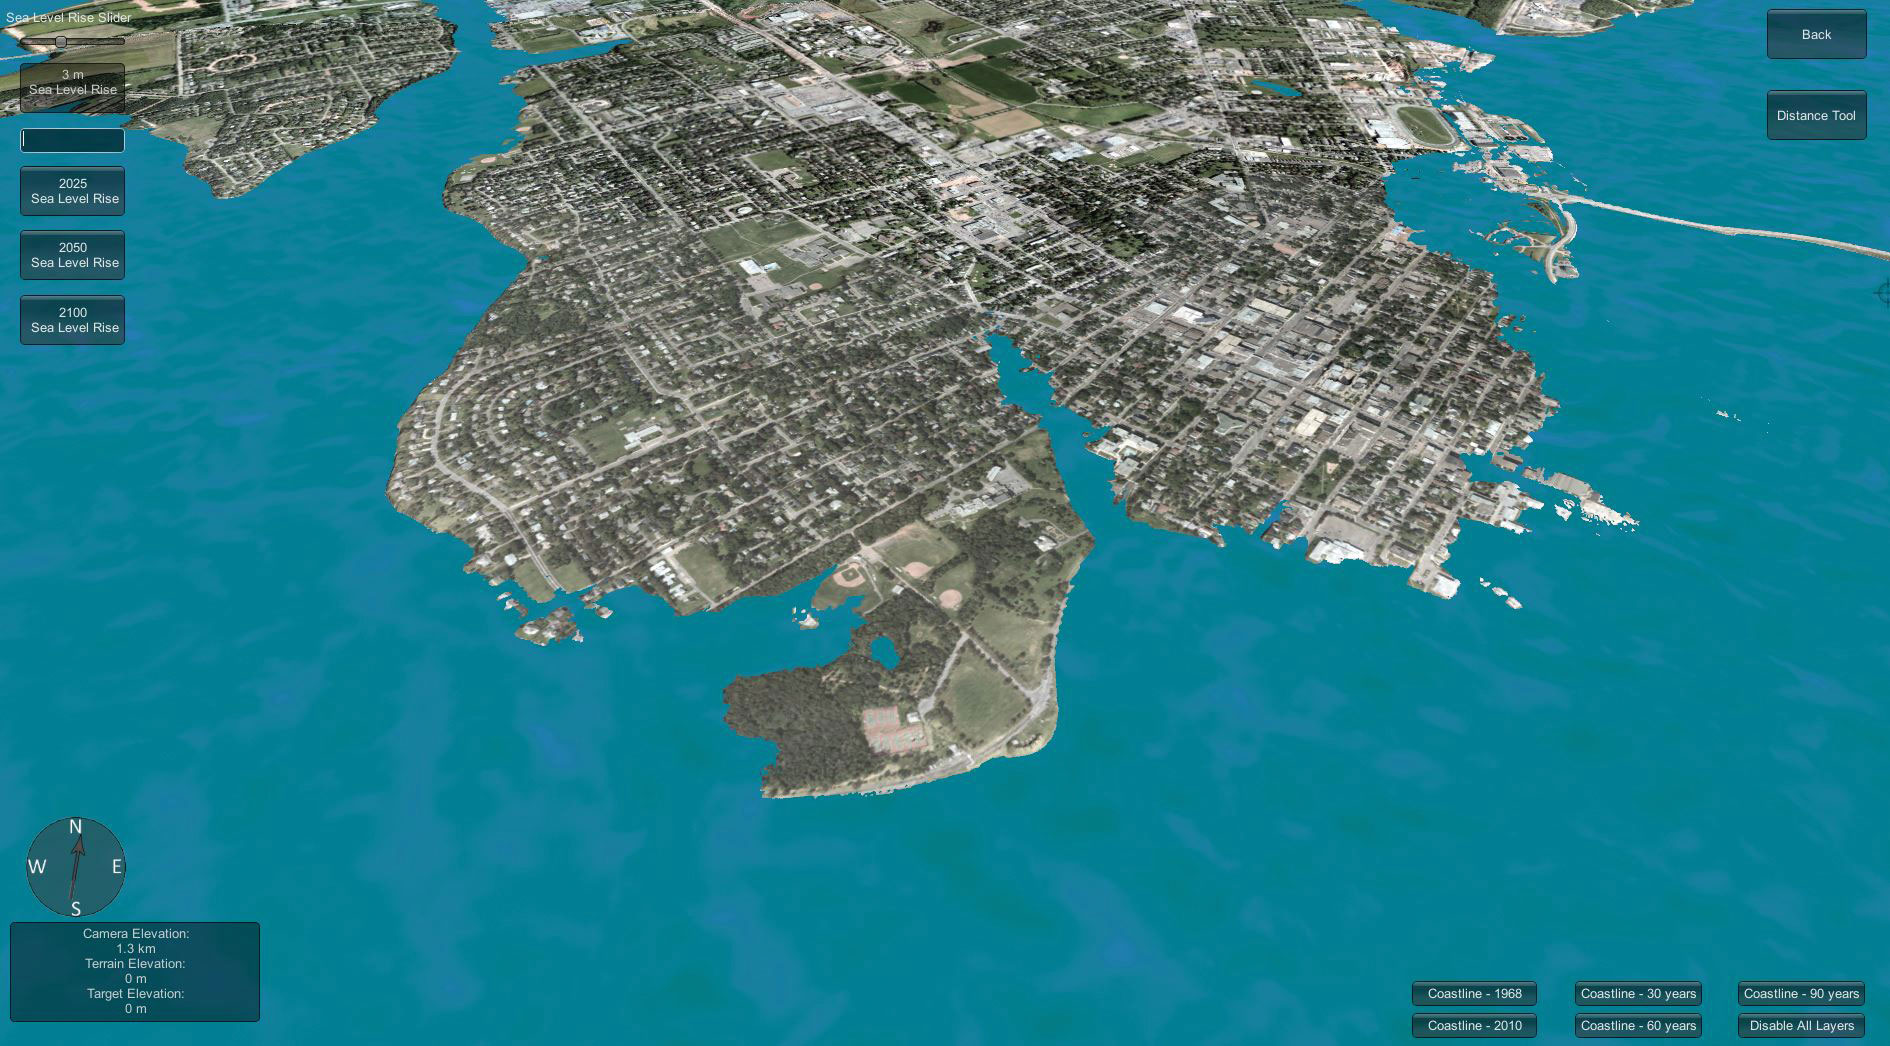
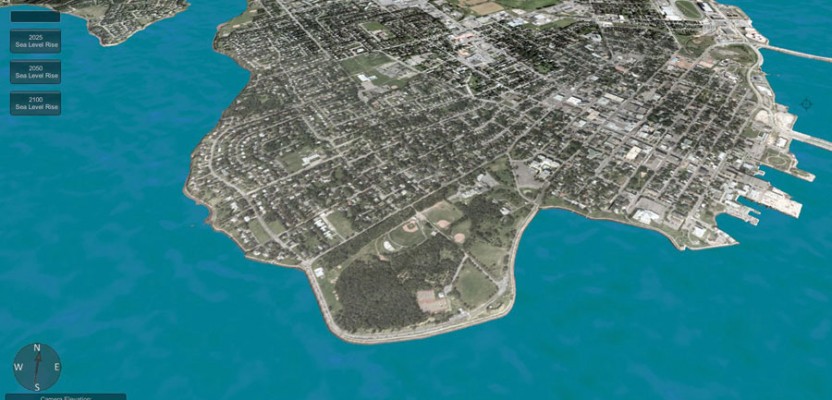
At a rise of 3 meters.
While initially developed with data for Prince Edward Island (PEI), where it has already been widely adopted, CLIVE can be easily adapted to other areas, using both local data and global models from the Intergovernmental Panel on Climate Change (IPCC). The tool allows users to interactively explore PEI’s coastlines and climate change, sea-level rise, and storm surge scenarios using real data and UPEI’s large collection of climate data and models. They can also incorporate current strategies for adapting to these changes, including setbacks, armoring, or mitigation approaches. The platform architecture is also designed to be used in situ with location-aware mobile devices, so that it will ultimately enable users to visualize past, present, and future coastline scenarios while standing in the real world.
Unlike a technical GIS, CLIVE is designed to deliver geospatial content analysis and geo-visualization without a cumbersome user interface. “Think of it as a cleaner, more elegant user interface to geospatial query and visualization,” says Hedley. “By making that interface more agile, we enable users to focus more immediately on the content and the questions, without needing much guidance, instruction, or support. We are opening the horizons of opportunities for a wider audience to engage with rigorous spatial data models. However, the science is not dumbed-down. We still have high quality, high resolution data in it.”
“With CLIVE you can fly around above PEI at any relative altitude while looking at the temporal progression of coastal erosion and the IPCC models,” says Hedley. “You can very easily toggle those layers on or off. You can also inspect past and future data from a first person, on-the-ground perspective—and this may be one of its most significant parts.”
Data
Data currently loaded into CLIVE includes projections from the 2013 IPCC findings, lidar-derived digital elevation data, satellite imagery, and an archive of orthorectified, high-resolution aerial photographs for all of PEI that document coastal erosion as far back as 1968. These data “provide high visual fidelity but also high spatial resolution and a context on which to place the historical coastal erosion data and also on which to hang the projected future sea level rise data,” Hedley explains.
“We also linked in the results from a coastal erosion study that we conducted,” says Fenech. “For every single meter of the coastline, we have what it looked like in 1968 and 2010 and, using the rates of erosion during those two time periods, what the coastline will look like in 30, 60, and 90 years.”
“We have digitized all of the buildings and structures that were within 300 meters of the coastline,” Fenech adds, “so it allows us to tabulate how many homes, cottages, light houses, barns, and wind turbines there are along the coast. We also want to look at graveyards and put in some socio-economic data. We are starting to load into CLIVE anything that is georeferenced, so it is not just a coastal erosion tool but an overall environmental change or social change visualization tool as well.”
Simulations
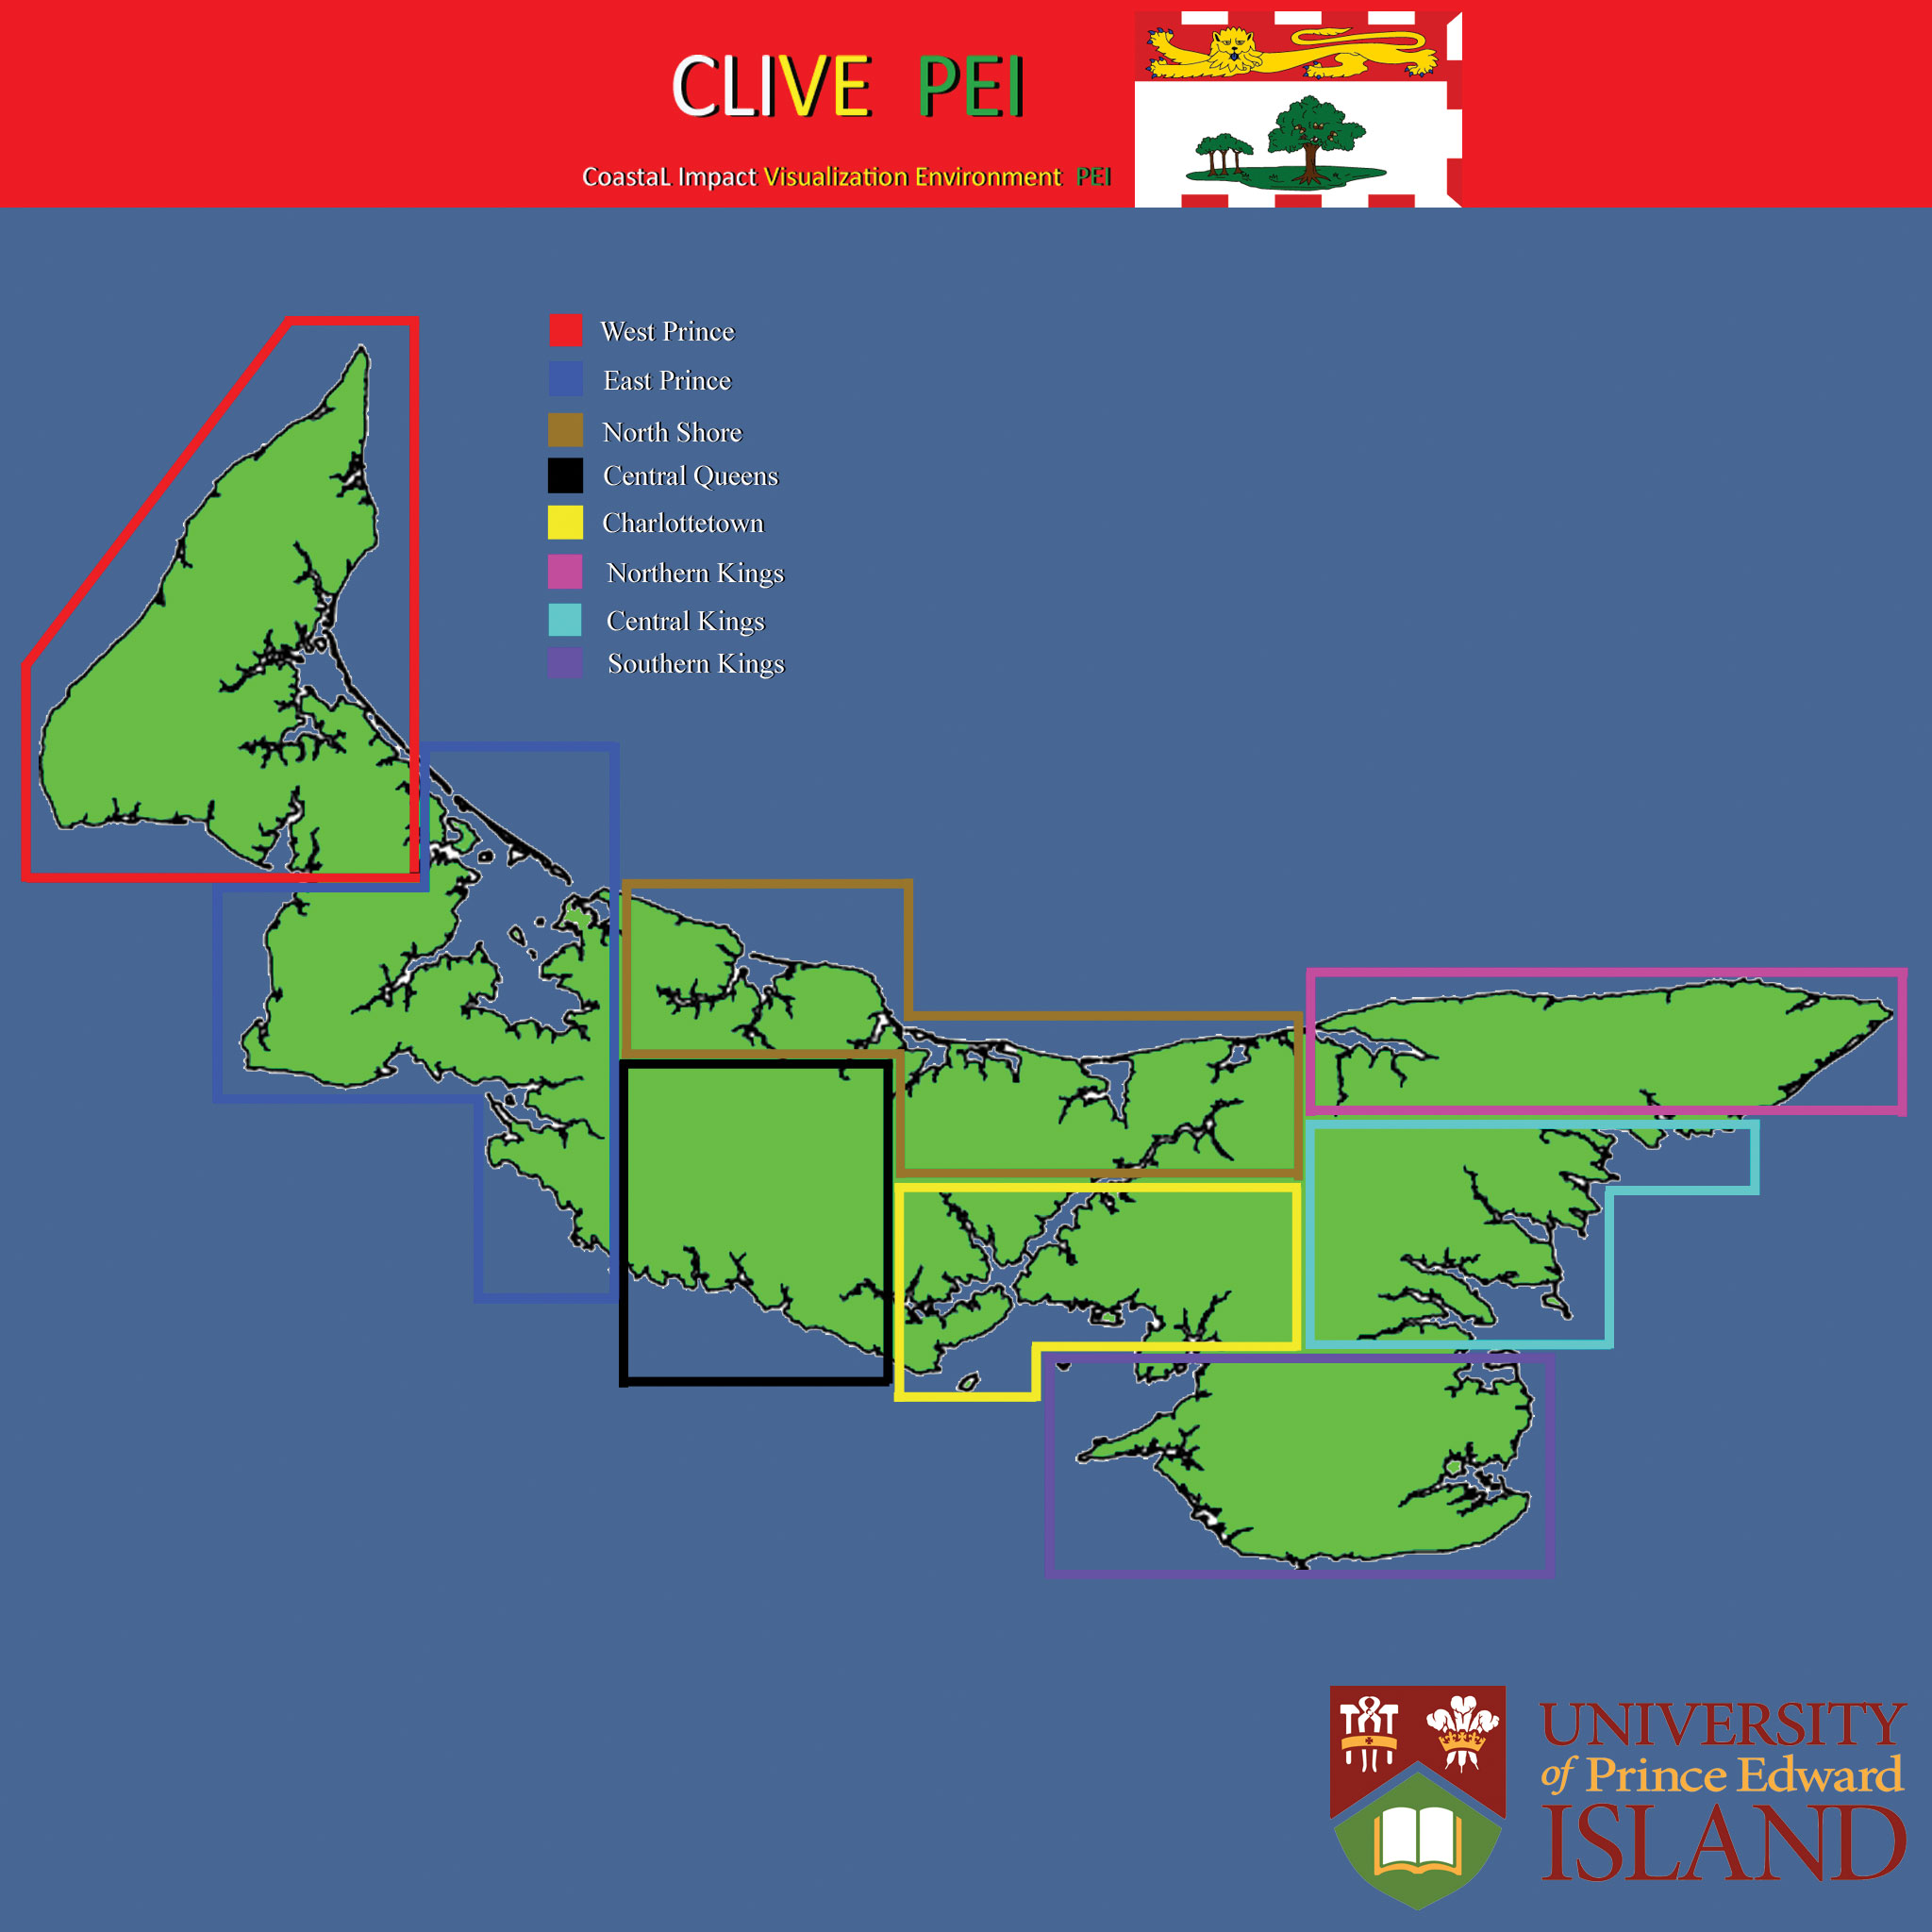
The main menu of the CLIVE interface showing all of Prince Edward Island.
The current version of CLIVE allows users to run simulations of storm surges against infrastructure, based on the projections in the IPCC’s most recent assessment report. “Sea levels, on average, are going to rise by one meter,” says Fenech. “So, we can use that simulation to look at a one-meter rise in a hundred years and also what the sea level might be like in the 2020s, 2050s, or 2080s.” The simulation also takes into account that the land itself is subsiding—at a rate of 10 to 20 centimeters per century.
CLIVE extrapolates what future erosion will look like if it continues at the current rate. However, Fenech points out, scientists believe that this rate will increase due to rising sea levels, land subsidence, and an increase in storms. “Environment Canada says that there will be an increase of about 10% to 20% in the number and severity of storms. All of that leads us to believe that things are going to be worse than what our CLIVE simulations show.”
The types of questions that Hedley and Fenech are asking primarily concern how the infrastructure—homes, bridges, roads, and buildings—is vulnerable to coastal erosion and storm surge. “They call it ‘creeping climate change’ in terms of the impacts, because they happen so slowly that the human brain can’t really assess them,” says Fenech. “Visualizing it over time shows the accumulated effect that these creeping changes will have.”
Fenech hopes that in about a year CLIVE will also be able to simulate the effects of introducing mitigation measures, such as sea walls.
Scientific Value
Besides its educational value, CLIVE also has scientific value, according to Fenech. “It shows us in a real, immediate sense, the vulnerable areas vs. the non-vulnerable areas. Your brain is always trying to interpret what maps mean, whereas the brain is used to the 3D environment, so it is easy to use. We have put a certain amount of precision into the tool that makes it very valuable. It is really great for us to just identify areas of sensitivity. We have an idea of where endangered species are—here it is the piping plover— […] but we are able to take a look at those areas in terms of their vulnerabilities to future storm surges and future coastal erosion.”
“We have some way to go in the GI science and geomatics field to deliver a truly three-dimensional GIS,” says Hedley. “You see tools like City Engine that are very interesting but exist more to generate the geometry of open environments. What we need is an equivalent 3D analytical capability for those sorts of environments. My lab actually developed both the visual and the analytical aspects of 3D problem spaces.”
The project’s most important achievement to date is the social and public engagement in PEI, according to Hedley. “CLIVE provides at least one pathway with which to bridge the abstract world of science with the real world of the impacts that citizens will have to face and to approach these challenges with eyes wide open.”