An interactive exercise merging the topo-graphical and the topo-logical.
At the conclusion of the first article in this series (April 2013, “Databased Mapping”), I provided a web link for readers to respond to a brief list of questions about software they’ve used for surveying-related mapping purposes. Surprisingly, there were a statistically significant number of responses. Well, okay—ten. But that made it really easy to tabulate the results as relative percentages. Here’s the summary:
Respondents were:
- Land surveying registrants: 50%
- Land surveyors, non-registrant: 10%
- GIS professionals: 20%
- Other (tree farm manager): 10%
This left one lone individual who didn’t declare his professional identification, which probably indicates an individual who is unsure whether declaring to be a surveyor is a good or bad thing.
Other results:
- The choice of mapping software was an even split between CAD and GIS users.
- All the CAD group used AutoCAD or the Carlson Survey extension to AutoCAD.
- The GIS users were a bit more diverse: most used Esri ArcGIS; the other responses were AutoCAD Map, Encompass, and the open-source Quantum GIS suite.
The comments relating to perceived problems in generating “hands-off” maps from a database were especially informative. All agreed that issues of pleasing cartography, rendering detail blowups, annotation, and marginalia placement would be problematic. Additionally, several of the respondents took the time to add comments relating to the amount of time that would be involved in setting up enough detail in the database versus the time saved in producing map outputs:
“… the density of points measured, and the required accuracy of the measurements, depend (among other things) on the scale of the final [map] that the surveyor will produce (i.e., 1:500) for a specific client. Thus the data base created from that data will not be suitable for creating hands off maps at higher scales (i.e., 1:200) for other clients. Mapping everything at very high scales in order to have a very detailed database from which to “subtract” data will result in both huge databases (difficult to store and handle) and extremely high workload[s] in field work.”
“[Issues include] setting up the system for a field to finish flow with [well-] defined standards. [Other] issues in some places are scale, convergence, and projection distortions, especially at higher elevations and northern latitudes. [Achieving a] cartographically pleasing [product] is also a big issue in my book—GIS maps are ugly. I love this—I tried to get my company to do this 10 years ago!”
Proving once again that you don’t need a lot of numbers to arrive at fundamental truths, these responses indicate a basic concern about obtaining full information content from a source (the database) that is ambivalent as to its final use. Creating truly useful maps from a database appears to be on the same order of difficulty as creating coherent narratives using only a dictionary. Or is it?
What Question Is Being Asked?
Although it wouldn’t seem to be relevant at first glance, the issue of obtaining appropriate answers via Web search engines is pertinent to our challenge of creating databased maps. In their book, Search Patterns, tech authors Peter Morville and Jeffery Callendar observe (and agree with our survey results) that, “Search applications demand an obsessive attention to detail. Simple, fast, and relevant don’t come easy. Success requires extraordinary focus in research, design, and engineering …” [1]
In Web searches, the art is in interpreting a query. In databased mapping, the art is in responding to a query that typically has no ambiguity (“produce a plat map”). But the under-the-hood dynamics of Web search engines and databased mapping are remarkably similar. In particular, the challenge of correlating results to queries is especially thorny.
In the technology of search engines, what’s being searched is broadly referred to as “content.” In particular, structured content (such as a database) presents at once the easiest and most complex source for search queries. On the one hand, asking for the record dimensions of a platted lot is straightforward in a CAD drawing file of the plat or even in a GIS cadastral reference database. But as to the bigger question of producing an entire plat map, complete with detailed schematics and tailored annotation, from just a database of points and lines? It seems to be out of our reach.
In Search Patterns, Morville and Callendar discuss the issue of structured results: answers in the form of diagrams and illustrations (and maps!) that offer a richer degree of insight for a particular query (pictures being worth a thousand words and all that). But then they say that such content itself will benefit from personalization: tweaking its presentation to more precisely answer the query. In other words, show me what I specifically asked for, not a general map that I have to analyze and interpret (Figure 1).
Storing Context-Responsive Data
This is the central premise of the databased map: surveying data can be stored in a database form that makes it suitable for a variety of mapping—and analysis—applications. Survey results are not your father’s spreadsheet and CAD file any more. The database doesn’t have to be “tuned” for a particular map product, nor should it be compromised by being a jack-of-all-trades data repository. So what would such a database look like?
Perhaps a useful way of framing the database design issue is to list some of the distinguishing characteristics between the paradigms of maps as digital drawings and maps as database query results. 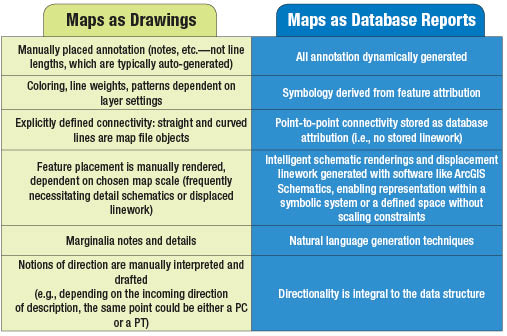
Many of these characteristics are inherent in the way that CAD and GIS systems fundamentally differ to begin with. But several characteristics, especially the issue of point-to-point connectivity, need to be considered in new ways.
In the 1980s I hacked some FORTRAN code together that produced Intergraph design files from specially formatted COGO entry files. (I think at one time or another, all programming-oriented surveyors either think about or actually do create their own COGO software. It must be part of the do-it-yourself mindset that typifies surveyors.) The COGO software that I labored over had two major code components in addition to the COGO calculation routines: a connectivity rules module and a connectivity description processor.
Each COGO’d point had not only an X,Y position but also a status value that defined the point’s real-world attribution, such as road centerline points, front lot corner points, rear lot corner points, lot sideline angle points, and so forth. The connectivity rules file contained the line/curve symbology for connecting point status values (e.g., a right-of-way line connecting two front lot corner points would have a heavier line weight, etc.). The connectivity processor would read each parcel’s point-to-point connectivity (Figure 2).
It was a bit more involved than this simple example and had coding conventions for curved segments, offset easements, and so forth. Polygon identifiers like ‘LOT’ and ‘BLK’ were directives for producing specific annotation and linework symbolization for various polygon types. In its one major deployment at the City of Tempe, Arizona, this rudimentary software produced 43,000+ Intergraph polygons with custom-specified linework and annotation.
Fast-forward ten years: in 1995 the software was encoded into SQL Server stored procedures for a project with the Salt River Pima-Maricopa Indian Community. The details of those procedures and accompanying database tables will be discussed in the next article.
Probably due to my bias of self-discovery, I’ve still not come across a significant improvement on this process. I hope that knowledgeable readers can quickly correct that assertion; it does need a substantial amount of improvement. For one thing, once you got into five-digit point numbers, transcription errors became a major problem. The connectivity description files had a certain amount of built-in checking (the sum of the areas for all the lots in a given block would have to equal the independently described block boundary area, for example), but still were fairly cumbersome to input.
As well, for all its generality, the program was focused on plat map analogs. And maybe that’s still a good solution for subdivision plats, but what we’re after is a mechanism for storing survey results and calculations that can produce a variety of authoritative map outputs.
As mentioned, in the next article a generic survey database schema will be presented that will attempt to answer some of these design challenges. Hopefully it will generate feedback that will guide its improvement in a true “crowd-sourced” fashion.
As to the issues of field-to-finish surveying workflow standardization and “smarter” data collector feature dictionaries? Fodder for future articles, no doubt.
FOOTNOTES:
- Morville, Peter and Callender, Jeffery. Search Patterns (Design for Discovery), O’Reilly Media, Kindle Edition, 2010.
- “The Salt River Pima-Maricopa Indian Community Measurement-Based GIS,”www.esri.com/industries/surveying/business/maricopa.